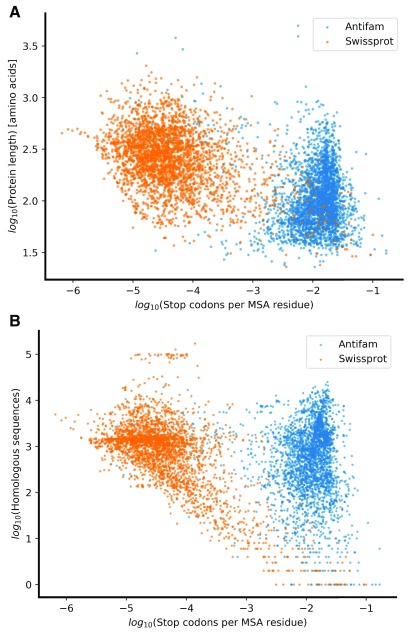
Figure 2. Scatter plots of the separation of AntiFam versus Swiss-Prot proteins.
Protein sequences were sampled from either Swiss-Prot (3,107 sequences shown in blue) or AntiFam (3,107 spurious sequence shown in orange). After preprocessing, every protein sequence is represented by a single dot in three-dimensional space. This dataset was later used for the training and testing a probabilistic classifier. ( A) Shows the log length versus the normalised log of the stop codons per aligned position. ( B) Shows the log number of tblastn hits versus the normalised log of the stop codons per aligned position. The raw data set can be found associated with this paper.

