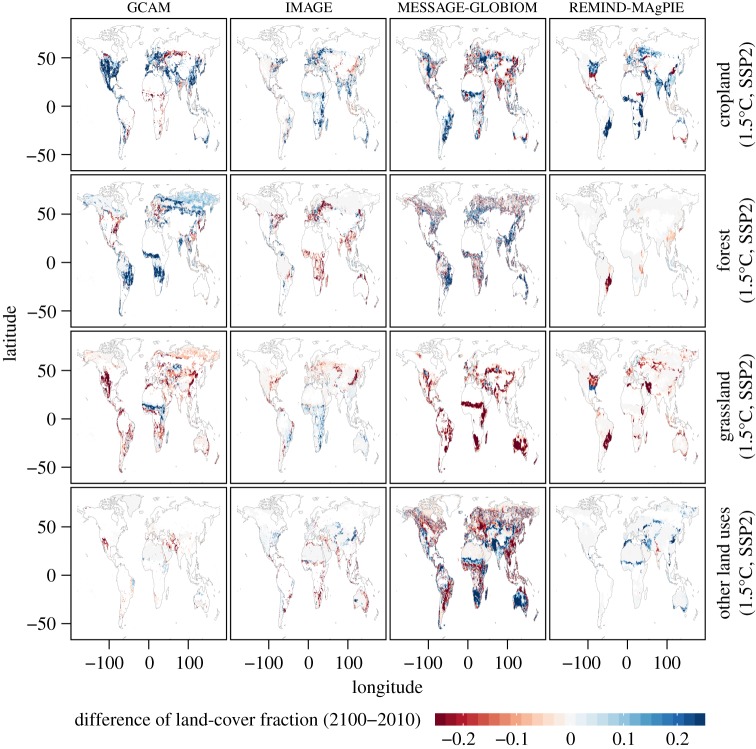
Figure 12.
Difference of land-cover fractions between 2100 and 2010 from the GCAM, IMAGE, MESSAGE-GLOBIOM and REMIND-MAgPIE IAMs grouped by land-cover type for 1.5°C of global warming and SSP2 scenario. Grid cells are masked if the land-cover fraction is less than or equal to 1%. The values are displayed as differences in fractional areas (unitless).

