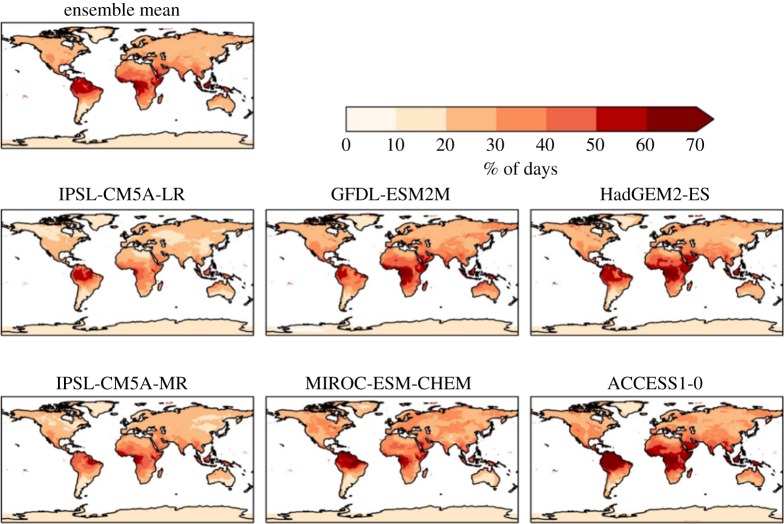
Figure 3.
Simulated changes in the percentage of days with daily temperature above the 90th percentile for 1981–2010 at 2°C global warming, for individual HadGEM3 simulations driven by SSTs and SICs from different members of the CMIP5 ensemble, and the ensemble mean. The labels above each panel identify the driving CMIP5 model (or ensemble mean).

