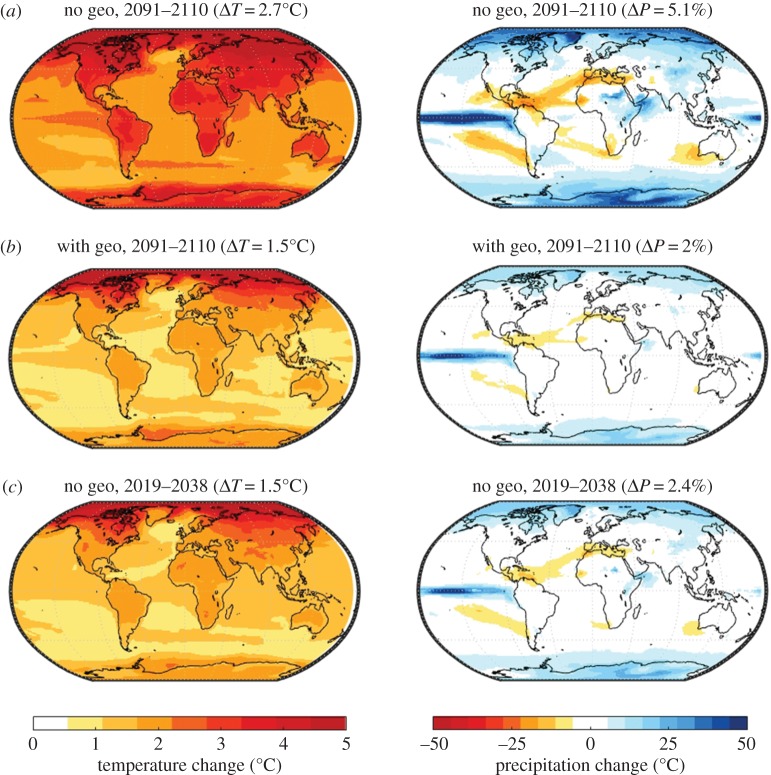
Figure 5.
Projected temperature and precipitation changes relative to preindustrial for the scenarios in figure 2; end-of-century response without (a) and with (b) geoengineering, and for comparison the warming from 2019–2038 (c) where the global mean temperature change is 1.5°C without geoengineering. Each panel also lists the global-mean change in temperature or the % change in precipitation. Median results are shown over 12 climate models participating in GeoMIP, estimated using a dynamic climate emulator (see appendix A).

