
Figure 4.
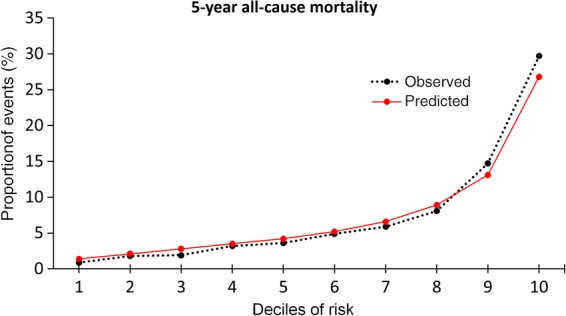
Calibration plot for LogitBoost model. The calibration plot shows the relationship between the observed and predicted proportion of events, grouped by decile of risk. The LogitBoost model showed good calibration with the observed 5-year risk of all-cause mortality.