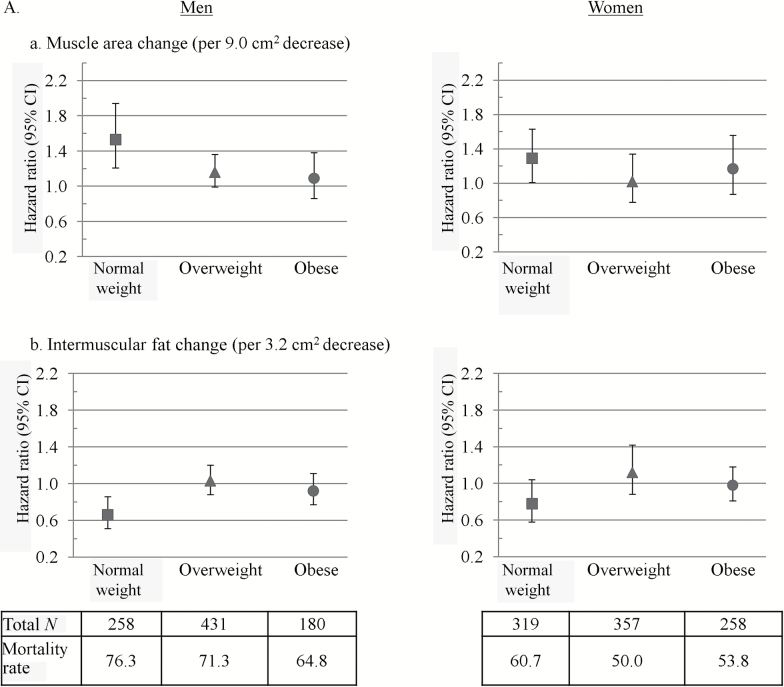
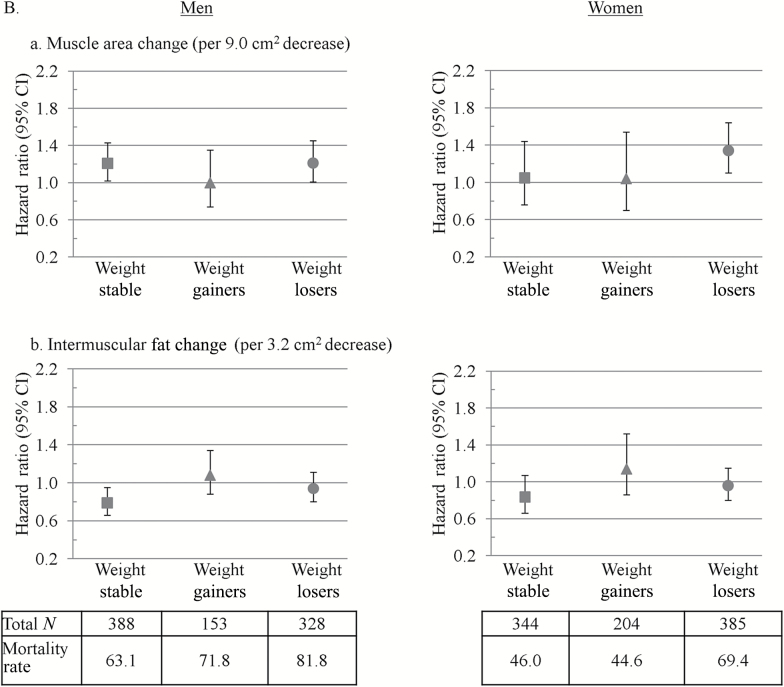
Figure 2.
Hazard ratios for mortality associated with changes in (a) intermuscular fat and (b) thigh muscle in men and women by baseline (A) body mass index (BMI) and (B) weight change status. Hazard ratios are from Cox models and are per SD change over 5 years with an increase as the referent. Models were adjusted for age, race, study site, physical activity, education (men only), smoking, baseline body composition measure, diabetes, cardiovascular disease, hypertension, chronic obstructive pulmonary disease (women only), depression (men only), Modified Mini-Mental State Examination score, and change in total body weight. Mortality rates are deaths per 1,000 person years. Thigh muscle area and intermuscular fat were measured by computed tomography. BMI groups were defined as follows: normal weight (BMI < 25.0kg/m2), overweight (BMI = 25.0–29.9kg/m2), and obese (BMI ≥30kg/m2). p Values for BMI category by muscle and intermuscular fat change interactions on mortality were p = .04 and p = .12 in men and p = .57 and p = .36 in women, respectively. Weight change groups were defined as follows: weight stable (<3% weight change), weight gainers (≥3% weight increase), and weight losers (≥3% weight decrease). p Values for weight change direction by muscle and intermuscular fat change interactions on mortality were both p = .06 in men and p = .11 and p = .39 in women, respectively.


