. 2018 Jan 22;9(8):2365–2375. doi: 10.1039/c8sc00004b

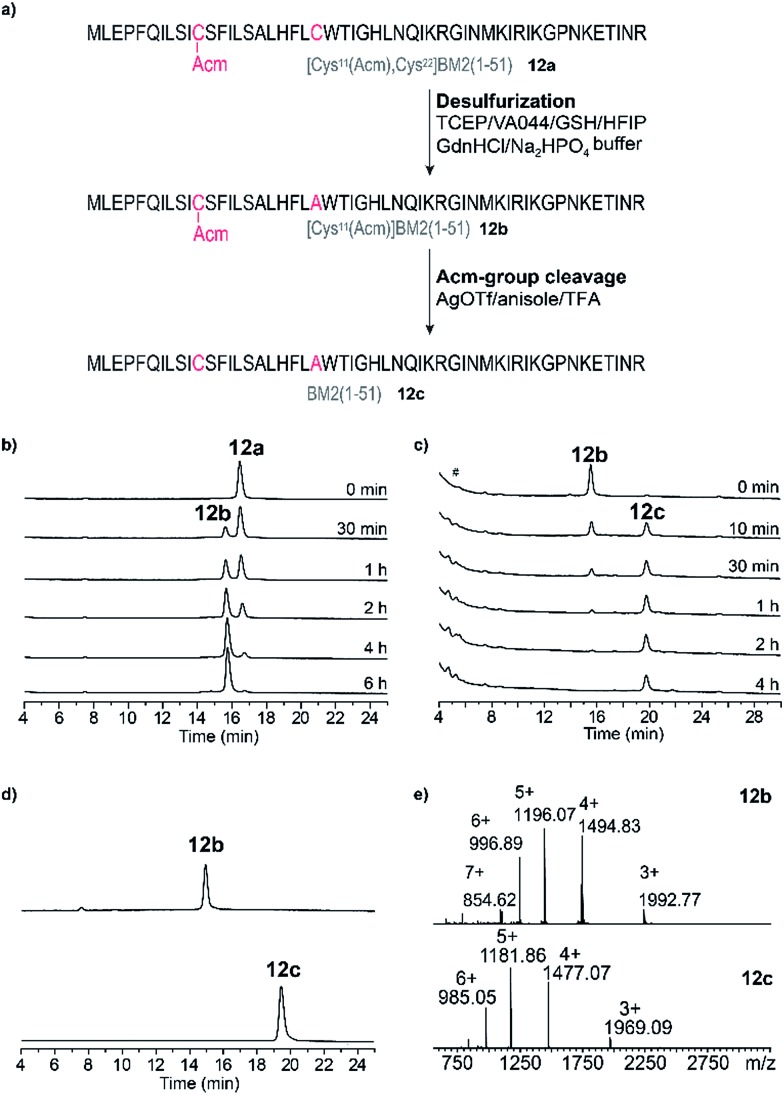
Fig. 6. (a) Schematic representation of the post-NCL desulfurization (product 12b) and cleavage of the Acm-group reactions leading to the final product BM2(1–51) (12c). Reaction conditions are highlighted for each step. (b) RP-HPLC elution profiles of the reaction mixture during desulfurization at different time points (directly after the reaction start (0 min)–6 h). (c) RP-HPLC elution profiles of the reaction mixture during cleavage of the Acm-group at different time points (directly after the reaction start (0 min)–4 h). # – injection peak. (d) RP-HPLC elution profiles of the purified products [(Cys11(Acm)]BM2(1–51)) (12b, upper trace) and the final product BM2(1–51) (12c, bottom trace). (e) ESI-MS spectra of [(Cys11(Acm)]BM2(1–51)) (12b upper spectrum) and BM2(1–51) (12c, bottom spectrum).

Fig. 6