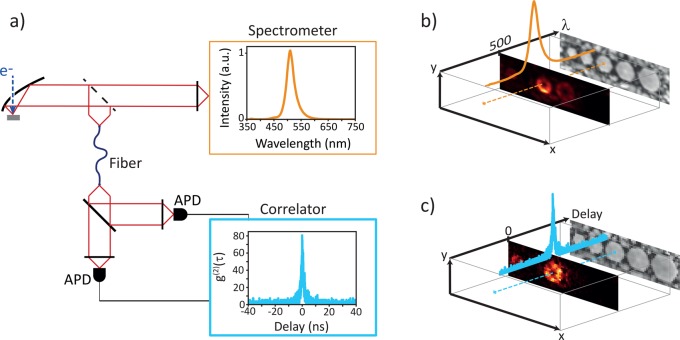
Figure 1.
Schematic view of the CL spectroscopy/g(2) experiment on InGaN/GaN QW NWs. (a) Layout of the measurement setup; the light emitted by the sample is collected by a parabolic mirror and sent to either a spectrometer (top path) to record the spectrum or a Hanbury Brown and Twiss (HBT) interferometer, in which the delay between photon detection in each of the two avalanche photodiodes (APD) is recorded by a correlator. A time histogram is built from which the autocorrelation function g(2)(τ) is derived. (b) Spectral data cube containing a CL spectrum and the SE intensity at each pixel. (c) Data cube containing autocorrelation time histogram.

