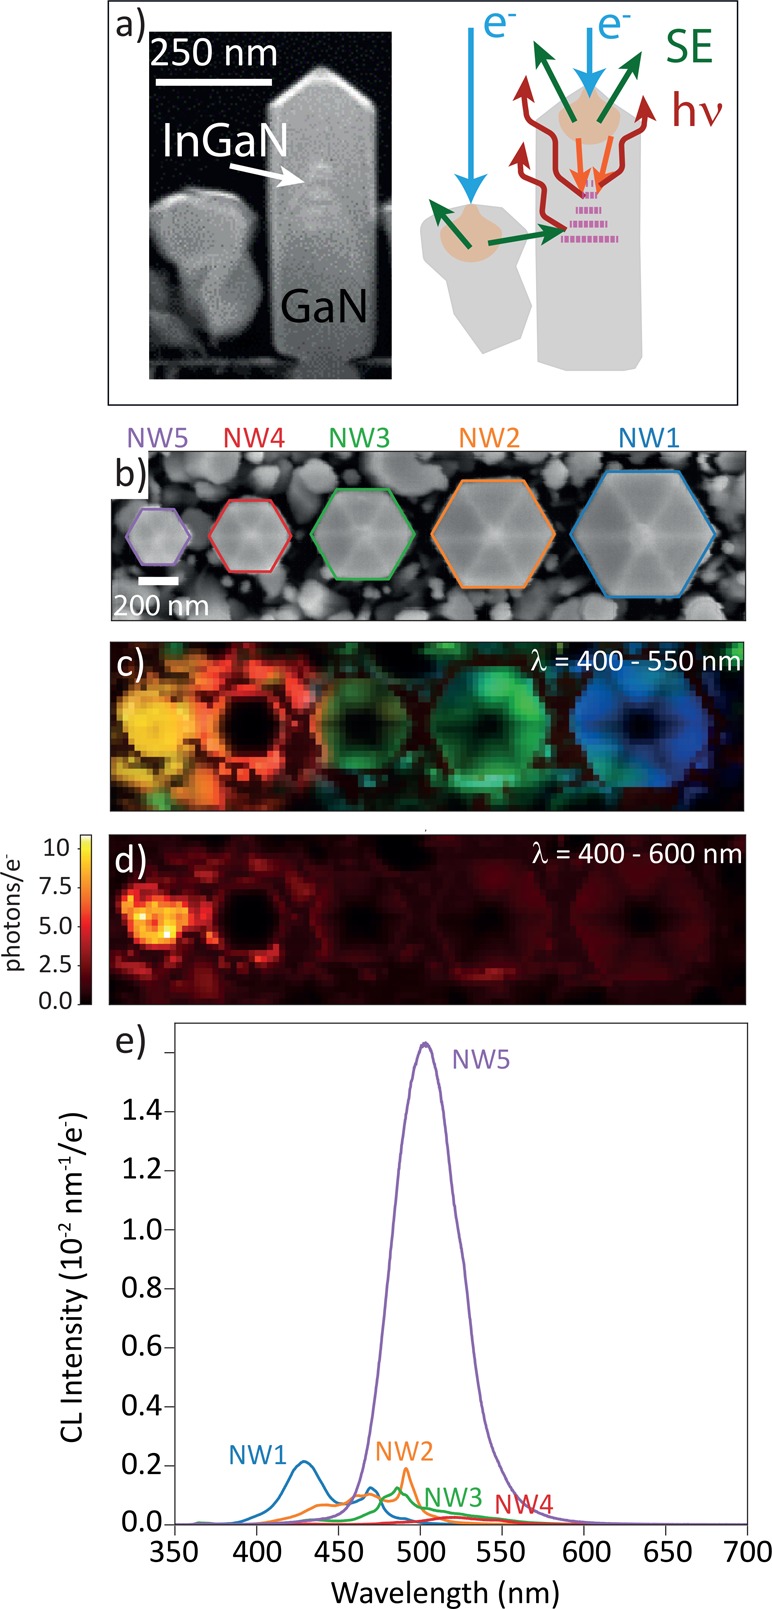
Figure 2.

Cathodoluminescence for InGaN/GaN QWs embedded in GaN NWs. (a) (Left) Cross section of a NW similar to NW5 and (right) schematic view of the excitation mechanisms that lead to CL emission (hν) either through direct excitation of the NW or by secondary electrons (SE) originating from surrounding NWs. (b) SEM image taken together with the CL data set shown in parts c, d, and e. (c) False-color RGB image of the CL data cube. The spectra are separated in 3 sections (in the range from 400 to 550 nm), which are binned such that the total intensity in these spectral regions defines an RGB code for every position. (d) CL intensity (photons per incident electron) integrated over the 400–600 nm wavelength range, corresponding to the filter used in the g(2) measurements. The color scale indicates the average number of photons emitted into the upper angular hemisphere (zenithal angle θ between 0° and 90°, where θ = 0° corresponds to the surface normal) per incoming electron within this spectral bandwidth. (e) CL spectra for the five NWs averaged over the full NW area.
