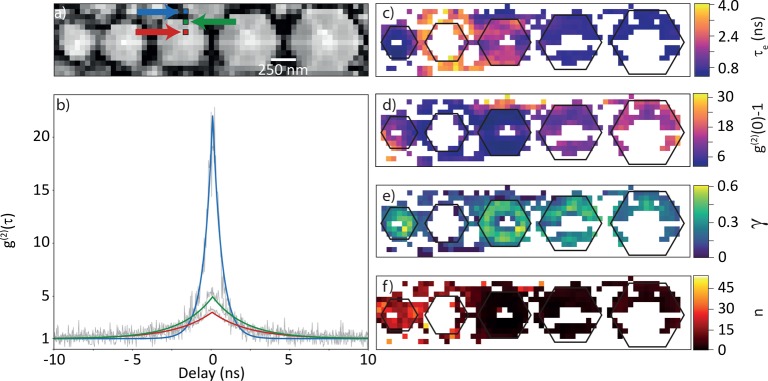
Figure 3.
g(2) maps for the NW array displayed in Figure 2. (a) SE intensity recorded together with the g(2) data set. The g(2) data recorded at three colored squares in part a as indicated by the arrows are shown in part b as well as the fits to eq 1 (colored lines). (c–f) Maps of lifetime τe, amplitude g(2)(0)-1, probability of excitation of the QWs γ, and average number of photons emitted per electron interacting with the QWs (n). The contours of the NWs are indicated by black lines.

