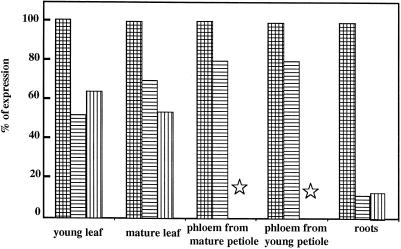
Figure 7.
Effect of salt stress on AgSUT1 expression in different organs of celery. Hatched bars, Control plants; horizontally striped bars, plants stressed for 4 weeks with 300 mm NaCl; vertically striped bars, plants rehydrated for 1 week after the salt stress. The results were obtained as described in Figure 6 (counting of radioactivity with an Instant Imager and calibration with a riboprobe), and the expression in control organs taken as 100%. Stars indicate non-determined conditions.

