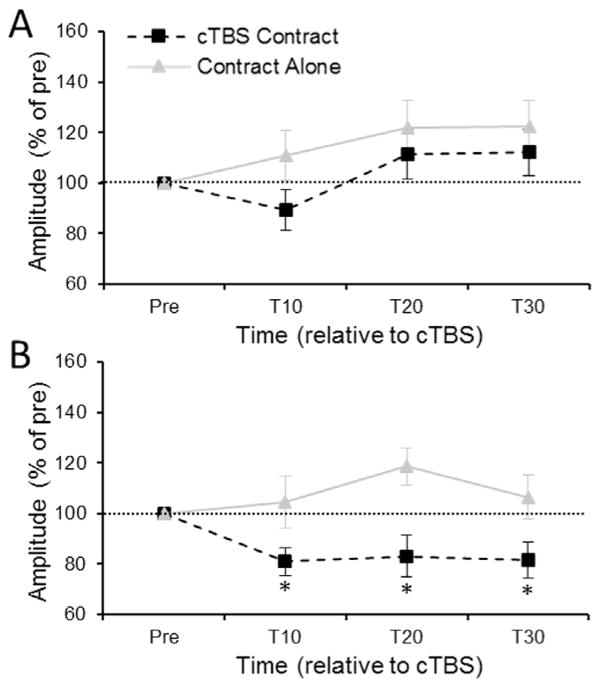
Fig. 5.
(A) FCR and (B) ECR MEP amplitude evoked from the FCR hotspot at 10-, 20- and 30-min post-intervention for the cTBS-Contract and Contract-Alone sessions. The horizontal dashed line represents pre-cTBS baseline amplitude. Error bars represent standard error of the mean. * denotes corrected p<0.05 when comparing raw MEP amplitude at a time point relative to raw pre-cTBS MEP amplitude.

