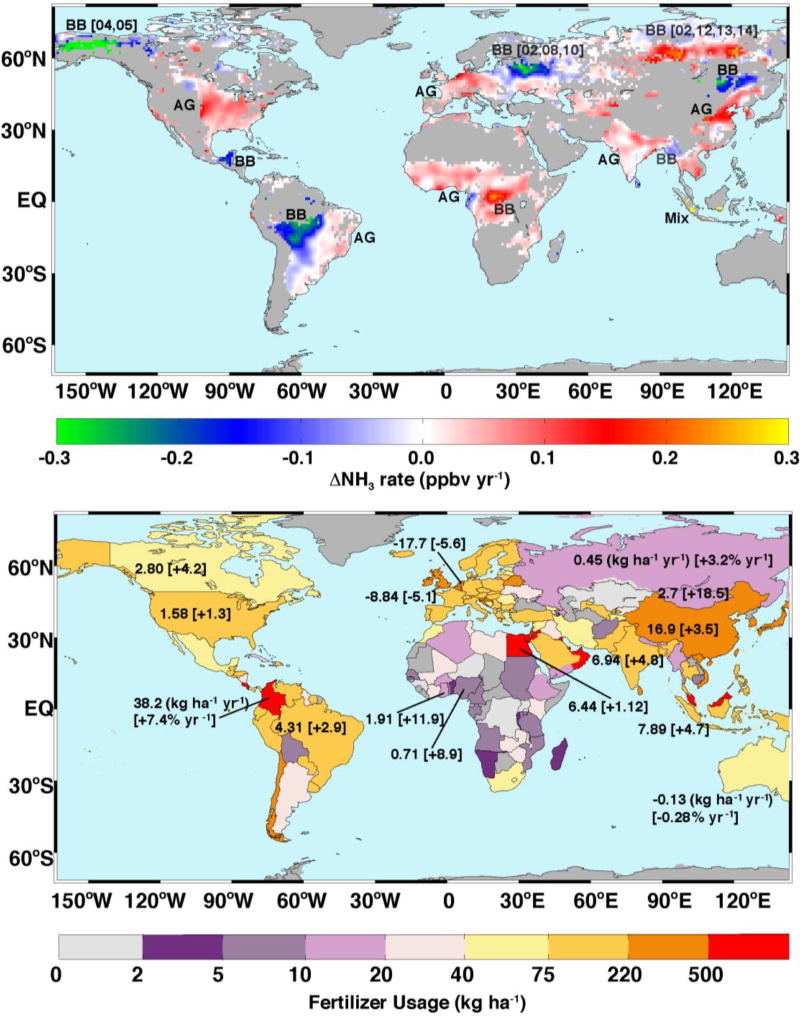
Figure 1. Trend in AIRS NH3.
Top: Temporal trends (+ 0.3 to −0.3 ppbv yr−1). The locations and the last two digits of the years of biomass burning events (in square brackets) are marked as BB. The main agricultural regions are marked as AG. Bottom: national averaged annual N fertilizer usage in 2002 – 2013 in kg ha−1 and trends [percentage changes] in kg ha−1 yr−1 [% yr−1]; see text for details.

