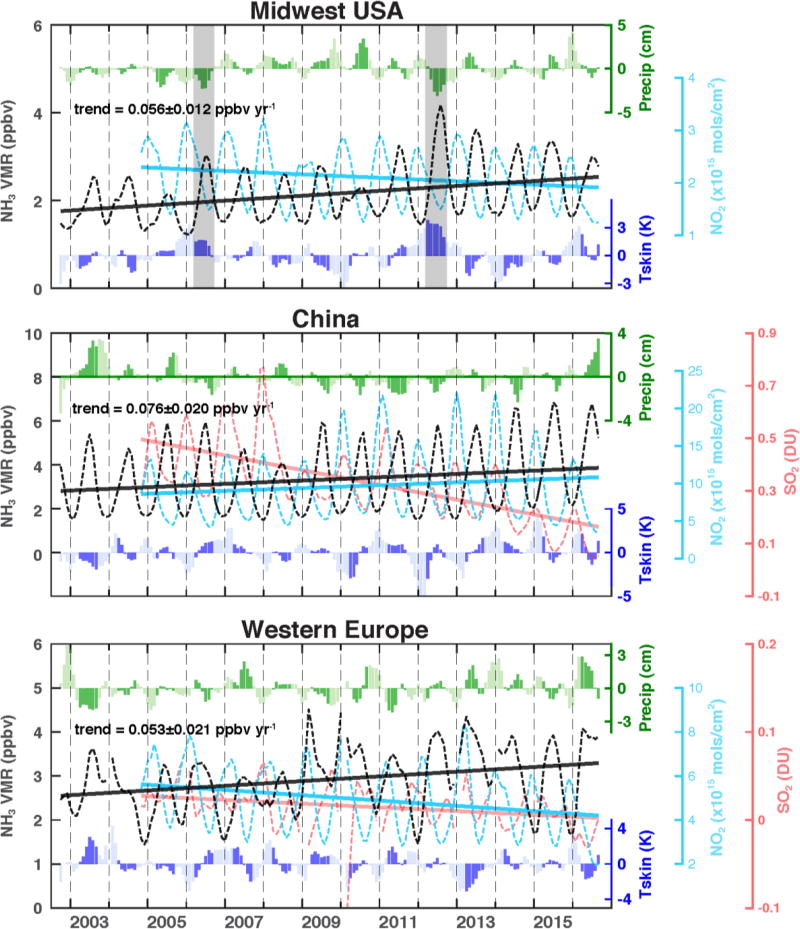
Figure 3. The recent (~14 year) trends of AIRS NH3 concentrations.
The NH3 concentrations (i.e., VMRs in ppbv) at 918 hPa are shown in black dashed curves, with linear fits in solid lines, for Midwest US (top panel), China (middle panel), and EU (bottom panel) averaged in each region, respectively. The NH3 increasing trends are correlated with OMI SO2 decreasing trends (red color curve, shown only for China and EU) and NO2 trends (cyan color). Also shown are the surface skin temperature anomaly (K, in blue color bars) and total precipitation anomaly (cm, in green color bars) from the ECMWF era-interim reanalysis.

