
Fig. 2.
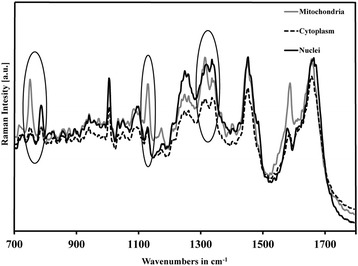
Predominant bands in Raman spectra of mitochondria (gray line), cytoplasm (dashed line), and nuclei (solid line) in cells. These peaks are used to distinguish different cell constituents
Official websites use .gov
A
.gov website belongs to an official
government organization in the United States.
Secure .gov websites use HTTPS
A lock (
) or https:// means you've safely
connected to the .gov website. Share sensitive
information only on official, secure websites.
Predominant bands in Raman spectra of mitochondria (gray line), cytoplasm (dashed line), and nuclei (solid line) in cells. These peaks are used to distinguish different cell constituents