
Fig. 3.
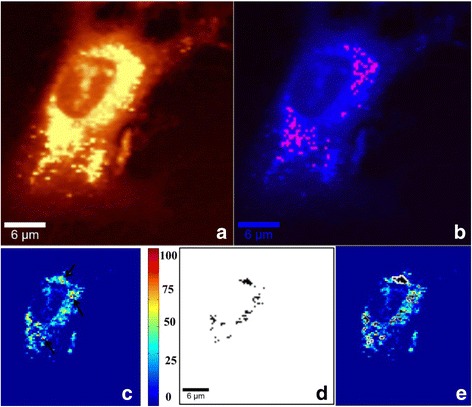
PTX uptake by DPSCs (Step 1). Incubation for 12 h with 10 μM PTX PBS solution, 60× water immersion objective. a Integrated Raman intensities in 2800–3000 cm−1 region of cells corresponding to C–H mode. b KMCA image to detect intracellular PTX (pink spots). c Pearson’s correlation map between whole cell Raman spectra and reduced cytochrome c Raman spectrum. Highest correlation obtained for red spots (indicated by black arrows). Region with no correlation to cytochrome c (navy blue) corresponds to fresh PBS buffer. d Mitochondria cluster (black) obtained from KMCA. e Mitochondria cluster overlapped in correlation map of cytochrome c; all positions corresponding to cytochrome c completely covered by the mitochondria cluster that indicates localization of cytochrome c within mitochondria