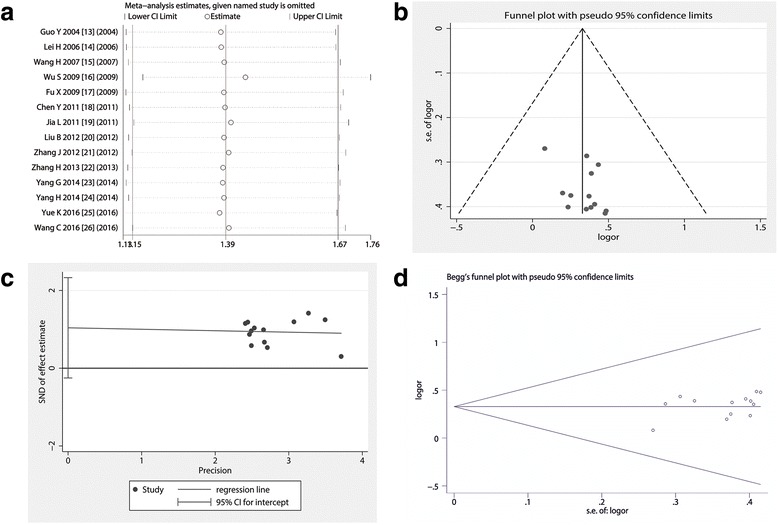
Fig. 5.

Sensitivity and publication bias analysis.a Omitting any trial did not shake the pooled effect of meta-analysis; b The shape of the funnel plot appeared to be approximately symmetrical; c Egger’s test showed that p was 0.105, suggesting included trials did not have a potential impact on the pooled effect of present meta-analysis; d Begg’s test showed that p value was 0.112, and the funnel plot seems to be nearly symmetrical
