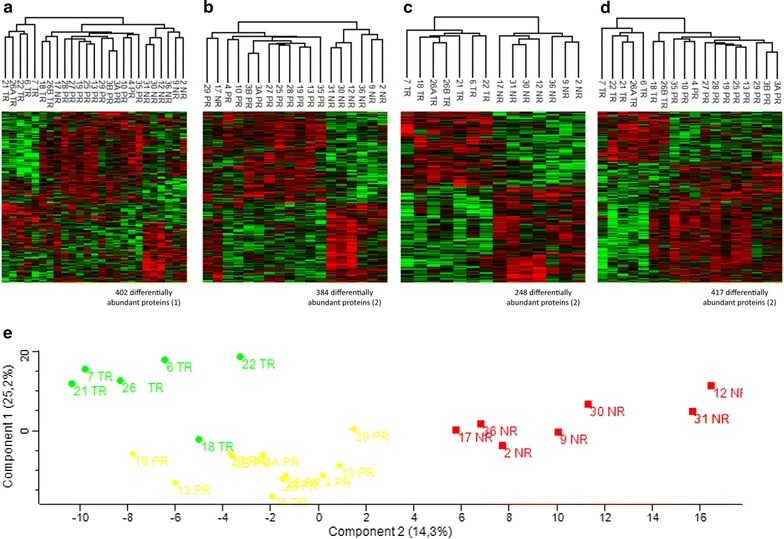
Fig. 4.

Heatmaps of differentially abundant proteins between groups of response and PCA plot showing the separation of these three groups. a Comparison between NR, PR and TR groups (NR non-responders, PR partial responders, TR total responders) resulting in 402 differentially abundant proteins. b Comparison between NR and PR groups resulting in 384 differentially abundant proteins (180 over-represented in NR and 204 in PR). c Comparison between NR and TR groups resulting in 248 differentially abundant proteins (139 over-represented in NR and 109 in TR). d Comparison between PR and TR groups resulting in 417 differentially abundant proteins (294 over-represented in PR and 123 in TR). Statistical tests used for these analyses are ANOVA test (1) and Student’s T test (2) both corrected with a p value of 0.05. e Principal component analysis (PCA) showing the separation between the three groups of response: TR in green diamond, PR in yellow circle and NR in red square. NR non-responders, PCA principal component analysis, PR partial responders, TR total responders
