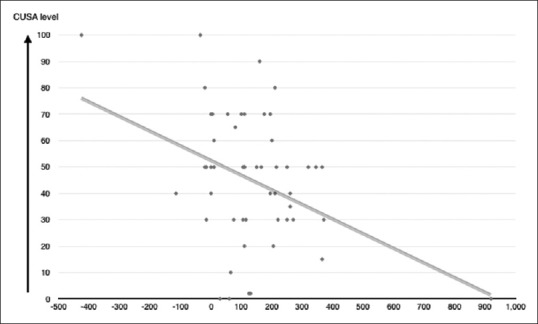
Figure 3.

Regression test (r) showed that there is a slight linear relationship between T2 mean regions of interest difference and mean CUSA values. In which mean CUSA value = 50.8 + (−0.055 × T2 mean regions of interest difference) (r = 0.4, P = 0.003)
