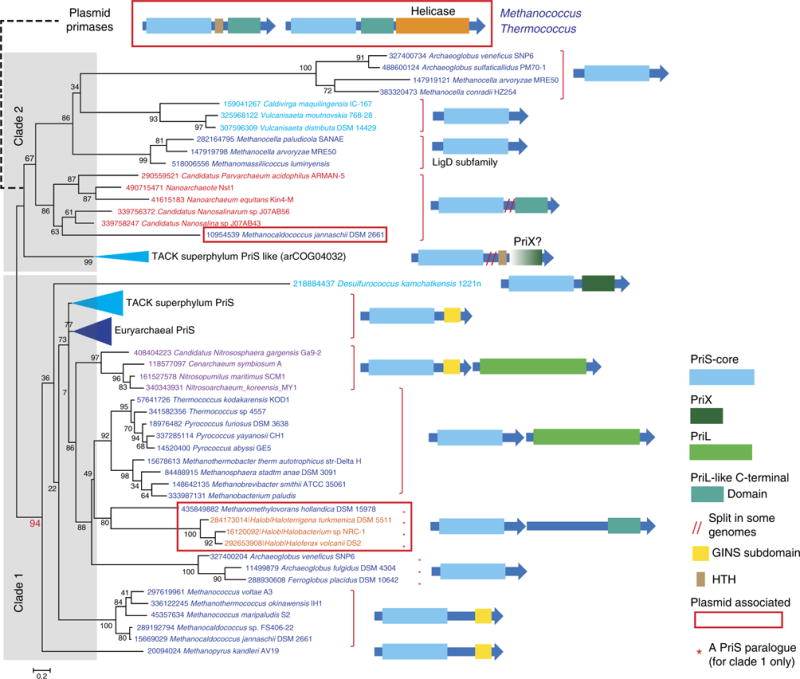
Figure 3. Phylogenomic analysis of the archaeal PriS family.

The maximum likelihood tree was reconstructed from a multiple sequence alignment that contained 112 sequences and 98 informative positions. Several branches are collapsed and shown as triangles denoted by the respective taxon name. The complete tree is available in Supplementary Fig. 3. The proteins are denoted by their GI numbers and species names. Colour code: Euryarchaeota, dark blue, with the exception of Halobacteria that are shown in orange; Crenarchaeota, light blue; Thaumarchaeota, Korarchaeota, purple; Nanoarchaea and other representative of small archaea, red. The conserved gene neighbourhoods and domain organizations are shown to the right of the tree for the respective branches. Homologous domains are shown by arrows of the same colour or shade. The dashed line shows the putative relationships between clade 2 and diverged PriL–PriS fusion protein encoded on euryarchaeal plasmids.
