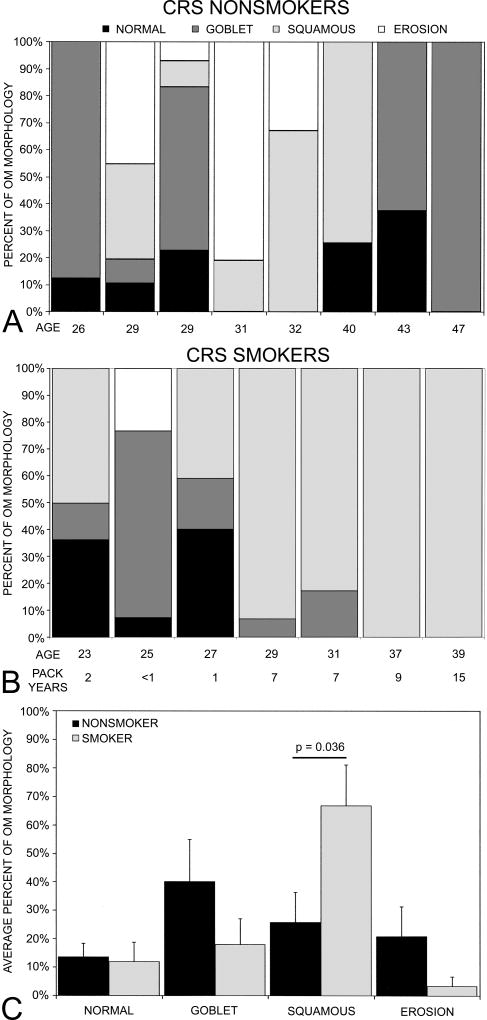
Figure 1.
The percent distribution of four different OM morphologies. The percent distribution of OM morphology (i.e., normal pseudostratified, goblet cell hyperplasia, squamous metaplasia and erosion) for A. individual CRS nonsmokers, B. individual CRS smokers in relation to age. The number of pack years is also included for CRS smokers.. C. The average percent distribution of the four OM morphologies for each group. Error bars = SEM.

