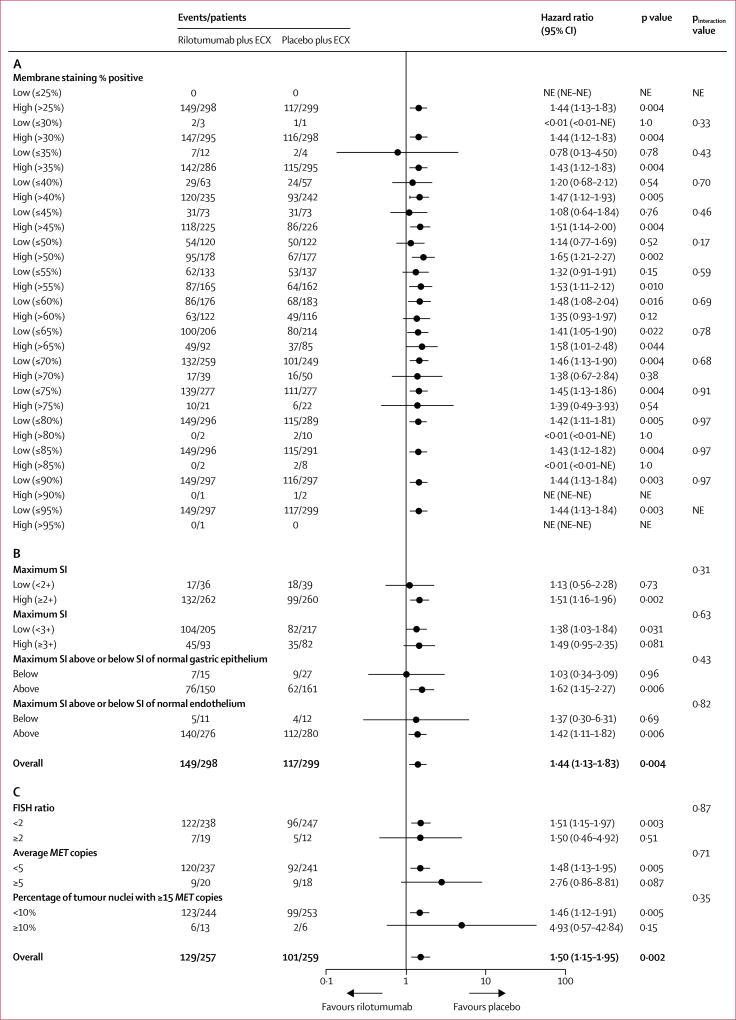
Figure 4. Treatment effect on overall survival by biomarker subgroup.
Forest plot assessing treatment effect on overall survival by (A) MET expression level measured as extent of tumour cell membrane staining (%) at staining intensity of 1+ or greater, (B) MET expression level measured as maximum staining intensity score, and (C) MET gene amplification level. ECX=epirubicin, cisplatin, and capecitabine. NE=not estimable. SI=staining intensity.

