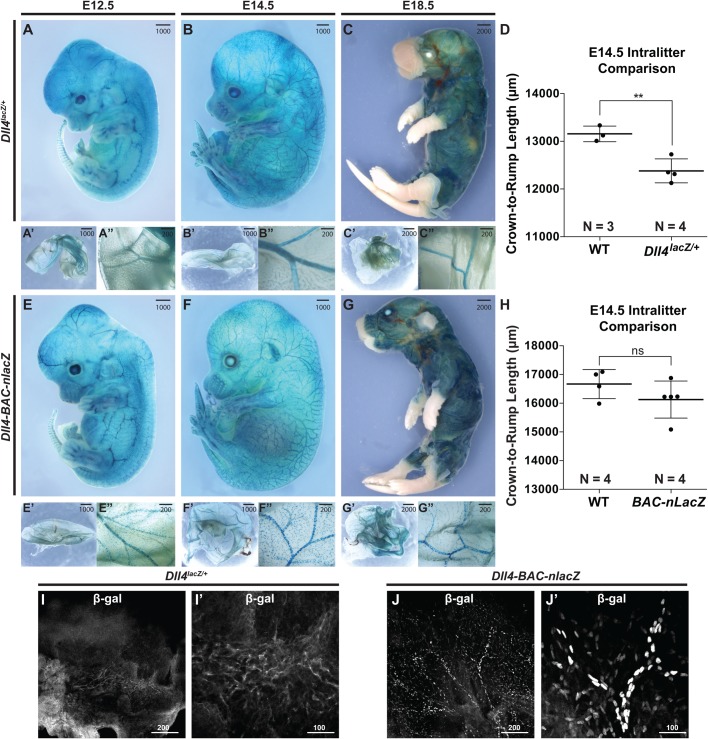
Fig. 2.
Comparative Dll4 expression during intermediate and late-stage embryonic development. (A-C) lacZ activity in E12.5 (A), E14.5 (B), and E18.5 (C) Dll4lacZ/+ mouse embryos and yolk sacs. (D) Intra-littermate body measurements in a Dll4lacZ/+ litter. Data are presented as averages ±s.e.m. Comparisons were made by Student's t-test (**P=0.0058). (E-G″) lacZ activity in E12.5, E14.5, and E18.5 Dll4-BAC-nlacZ mouse embryos (E-G) and yolk sacs (E′-G″). (H) Intra-littermate body measurements in a Dll4-BAC-nlacZ litter. Data are presented as averages ±s.e.m.; ns, nonsignificant. Comparisons were made by Student's t-test. Noticeable size differences can be observed between genotypes due to heterozygous Dll4 loss of function. (I-J) β-gal IHC on E14.5 skin from (I) Dll4lacZ/+ or (J) Dll4-BAC-nlacZ embryos. I′ and J′ are magnified views of a respective region shown in corresponding panels I and J. Units depicted are in μm.

