Fig. 1.
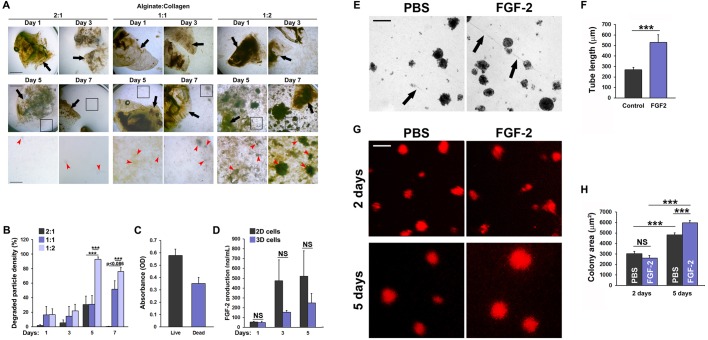
Alginate:collagen hydrogels support controlled release of therapeutic factors and cell viability in vitro. (A) Bright field micrographs of 2:1, 1:1 or 1:2 mixtures of alginate:collagen hydrogel patches incubated in cell growth medium at 37°C for 1-7 days. Black arrows indicate intact hydrogel pieces. Red arrowheads indicate pieces of degraded hydrogel material, black boxes indicate the region shown in the enlarge image below the overview image. Scale bars: 1000 µm in the first two rows and 500 µm in the third row. (B) Quantification of the mean cumulative degradation (density of degraded hydrogel particles) of the hydrogel patches after 1, 3, 5 and 7 days of incubation. 2:1, 1:1 and 1:2 indicate the relative concentrations of alginate to collagen. Error bars indicate s.e.m. ***P<0.001. n=7. (C) Quantification of the mean absorbance of dyes labeling living versus dead K1000 cells following overnight incubation embedded in 1:1 alginate:collagen hydrogel patches. n=12. (D) ELISA quantification of free hFGF2 in the medium of 1:1 alginate:collagen hydrogel patches containing 106 K1000 cells and incubated for 1-5 days in DMEM growth medium at 37°C. Error bars indicate s.e.m. n=4. (E) Bright field micrographs of 1:1 alginate:collagen hydrogel patches made with PBS or 1000 ng/ml FGF2, 6 days after 106 PAECs were seeded onto their surface and incubated in DMEM growth medium at 37°C. Black arrows point to PAEC tube-like structures. Scale bar: 100 µm. (F) Quantification of the length of tubes as indicated in C. ***P<0.001, n=8. (G) Fluorescent micrographs of DiI-labeled PAECs grown for 2-5 days in DMEM at 37°C on 1:1 alginate:collagen hydrogel patches made with PBS or 1000 ng/ml FGF2. Scale bar: 100 µm. (H) Quantification of the area of the red colonies shown in E. ***P<0.001, n=115, 124, 309, 295 colonies were counted from six images in the 2 days PBS, 2 days FGF-2, 5 days PBS and 5 days FGF-2 groups, respectively.

