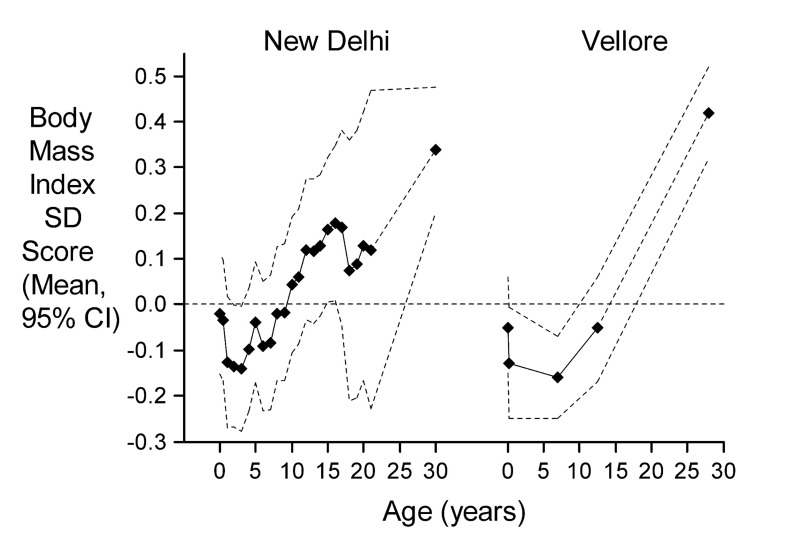
Figure 1.
BMI SD scores from birth to adulthood for participants in each cohort who developed IGT or diabetes (n=219/1562 in NDBC and 424/2218 in VBC) in adult life relative to the whole cohort (dashed zero line). BMI, body mass index; IGT, impaired glucose intolerance; NDBC, New Delhi Birth Cohort; VBC, Vellore Birth Cohort.

