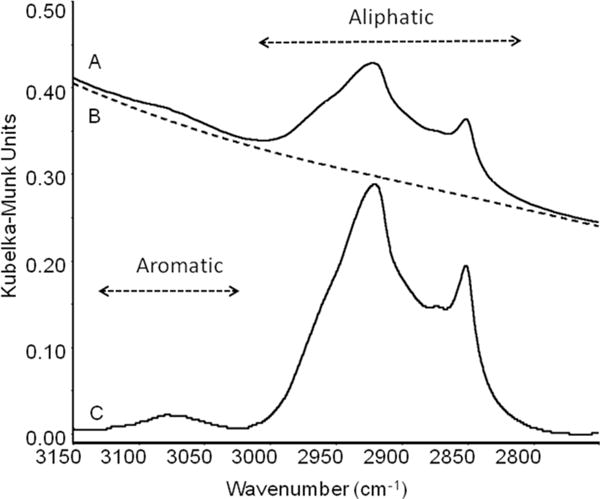
Fig. 5.

Diffuse reflectance Fourier-transform infrared spectrum of the Inceptisol soil without biochar addition at the beginning of the experiment (D0). Spectrum A corresponds to the original spectrum, Spectrum B is the baseline used to correct Spectrum A, calculated using a quartic polynomial function to correct the spectrum with x axis points (3227, 3212, 3184, 3154, 3132, 3006, 2796, 2785, 2768, 2749, 2695, and 2655). Spectrum C is the resulting baseline-corrected spectrum (expanded 2×). The aromatic and aliphatic regions are indicated, and the areas of these two regions represent the Ar/Al ratio.
