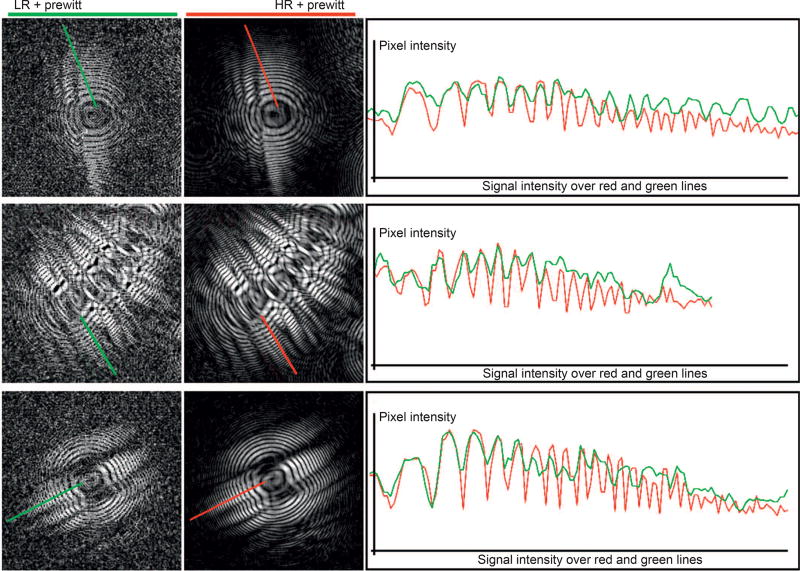
Figure 4.
Quantitative evaluation of LR and reconstructed HR holograms. LR and HR holograms are shown at the left and right side, respectively. A measure of the intensities was performed over the red and green lines drawn on the LR and HR resolution hologram, respectively. At the right side, these intensities were plotted, showing a better propagation and signal discrimination for the HR holographic images.

