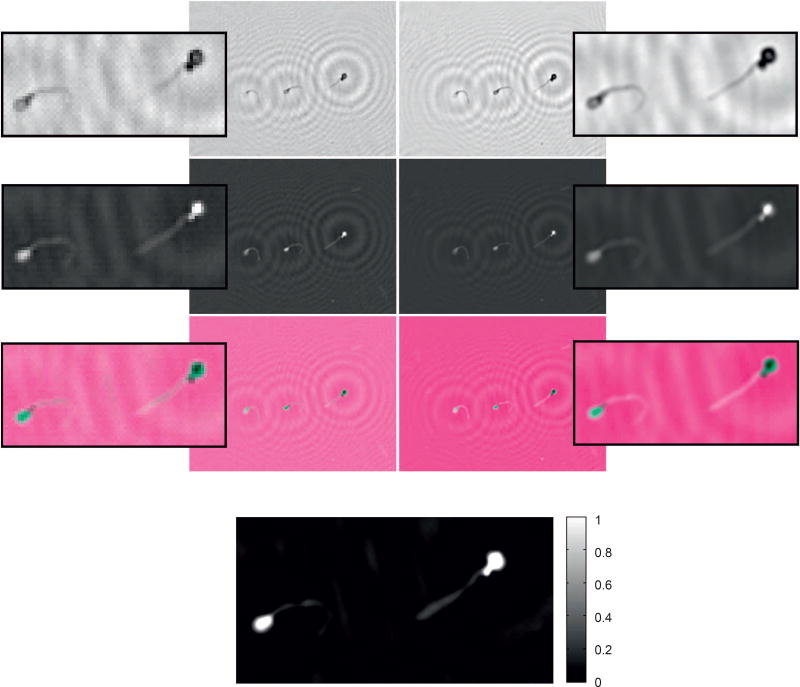
Figure 5.
Comparison of reconstructed LR (left side) and HR (right side) holograms, recovered from holograms shown in Figure 3 (first row holograms). From the first to third rows, the amplitude, phase, and multi-dimensional RGB composition signals are shown, respectively. Last row shows the normalized HR phase in radians, having values corresponding to (min. = −1.43, max. = 3.1416).

