
Figure 4. Gene Transcriptional Activation of Mutated STAT3.
(A) Unsupervised hierarchical clustering of top 100 genes with higher variance of expression across the control and reconstitute STAT3−/− MEF cells: backbone vector (pLentiPGKpuroDEST, in brief DEST), WT, AV, DY, KY, and YF STAT3 cassettes. Control (nil) cells are included. Cells were cultured in low serum or in the presence of recombinant human IL-6 (50 ng/ml for 30 min).
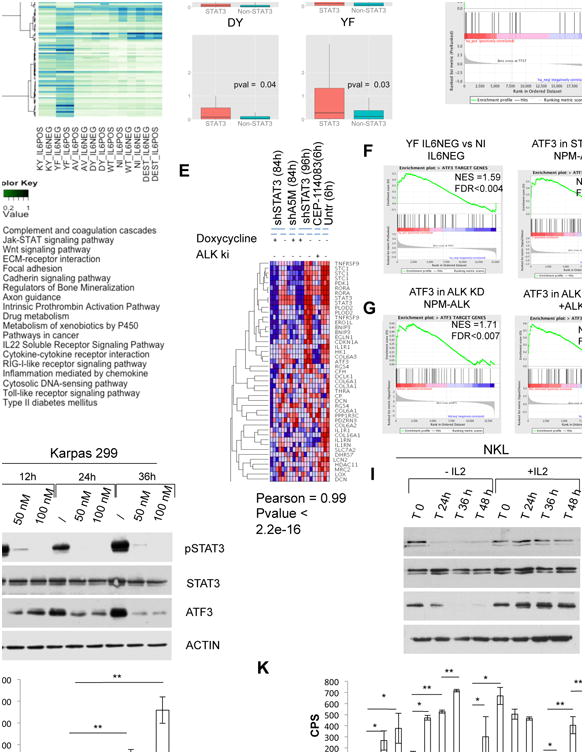
(B) Log2 fold change of genes belonging to STAT3 target genes (up- and downregulated) and the remaining genes in DEST, AV, DY, and YF STAT3 reconstitute STAT3−/− MEF cells. All fold changes are computed versus empty vector STAT3−/−. The p values were calculated with the Wilcoxon rank sum test.
(C) GSEA of STAT3 gene targets in YF STAT3 cells versus control (nil, DEST) STAT3−/− MEF.
(D) Heatmap of overrepresented pathways among up- and downregulated genes in YF/KY STAT3 and AV/DY STAT3 MEF cells. Pathway enrichment is measured by hypergeometric p values.
(E) GSEA of ATF3 target genes: YF STAT3 mutant versus STAT3−/− MEF (upper left); non-induced versus STAT3 shRNA NPM-ALK (upper right); non-induced versus doxycycline-induced ALK shRNA NPM-ALK (lower left); untreated versus CEP14823 treated NPM-ALK cells (lower right).
(F) Immunoblotting from whole-cell lysates of NPM-ALK ALCL cells (Karpas 299) treated over time with an anti-ALK inhibitor (CEP28122).
(G) Immunoblotting from whole-cell lysates of NKL cells supplemented with (20 ng/ml) or without human recombinant IL-2.
(H and I) Luciferase expression of cells with single- or double-transfected STAT3−/− MEF cells. The p values (*p < 0.01 and **p < 0.001) are indicated. Values correspond to the mean ± SD.
See also Figure S4 and Tables S5 and S6.