
Figure 7. Oncogenic Role of NFkB2-ROS1 Fusion.
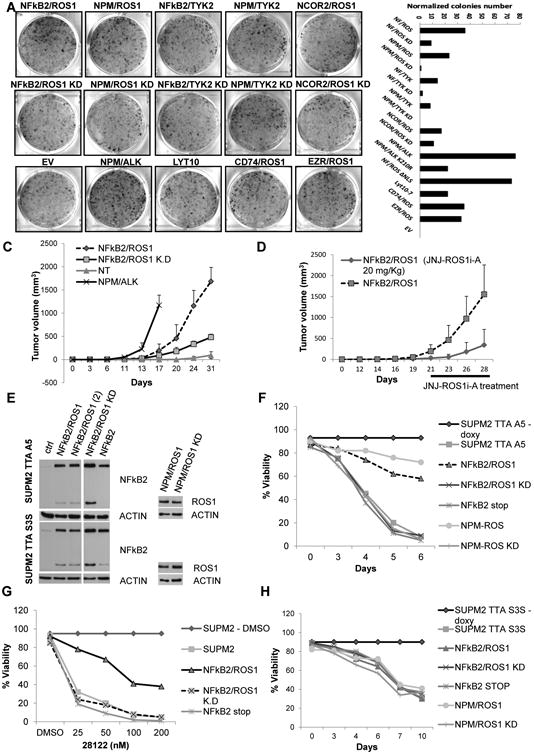
(A) Colony assay of NIH 3T3 cells after transfection with fusion and control cassettes. Number of colonies at day 14 after transfection are depicted. Values correspond to the mean ± SD.
(B) Tumor growth of transfected NIH 3T3 in NSG mice. Values correspond to the mean ± SD.
(C) Tumor growth of transduced NIH 3T3 with NFkB2/ROS1 in NSG mice (vehicle and anti-ROS, 20 mg/kg; six tumors per group). Time schedule is indicated. Values correspond to the mean ± SD.
(D) Viability of inducible shRNA ALK engineered NPM-ALK cells. Cells were infected with different lentiviral preparations, coding for control and ROS1 fusions, and then after puromycin selection were treated with doxycycline.
(E) Viability of inducible shRNA STAT3 engineered NPM-ALK cells. Cells were transduced with different lentiviral preparations and then after puromycin selection induced with doxycycline.
(F) Immunoblotting from whole-cell lysates of transduced cells with shRNA ALK (TTA A5) and shRNA STAT3 (TTA S3S) lentiviral cassettes.
(G) Western blot analysis of HEK293T cotransfected with NFkB2/TYK2 or NPM/TYK2 cassettes and a specific shRNA expression vector.
(H) Western blot analysis of SUP-M2 transduced with NFkB2/TYK2, NFkB2/TYK2 KD, and control viruses.
See also Figure S7.