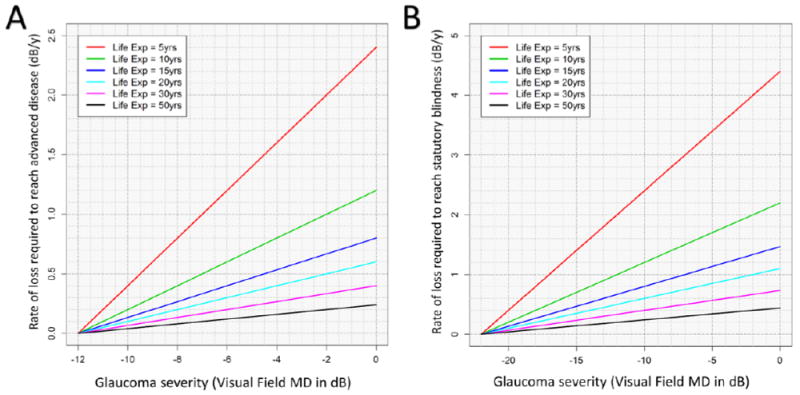
Figure 1.

Incorporating severity of disease and life expectancy to identify clinically important rates of progression for an individual patient. The baseline visual field mean deviation (MD) is on the x-axis. The y-axis represents the linear rate of visual field loss that will result in advanced disease (Figure A) and blindness (Figure B). Advanced disease is defined as MD ≤ -12dB in Figure A, while Figure B uses an MD ≤ -22dB to represent statutory blindness. By estimating the patients remaining life expectancy, a critical rate of visual field loss to avoid can be defined. Each colored line corresponds to a different life expectancy (Life Exp) remaining.
