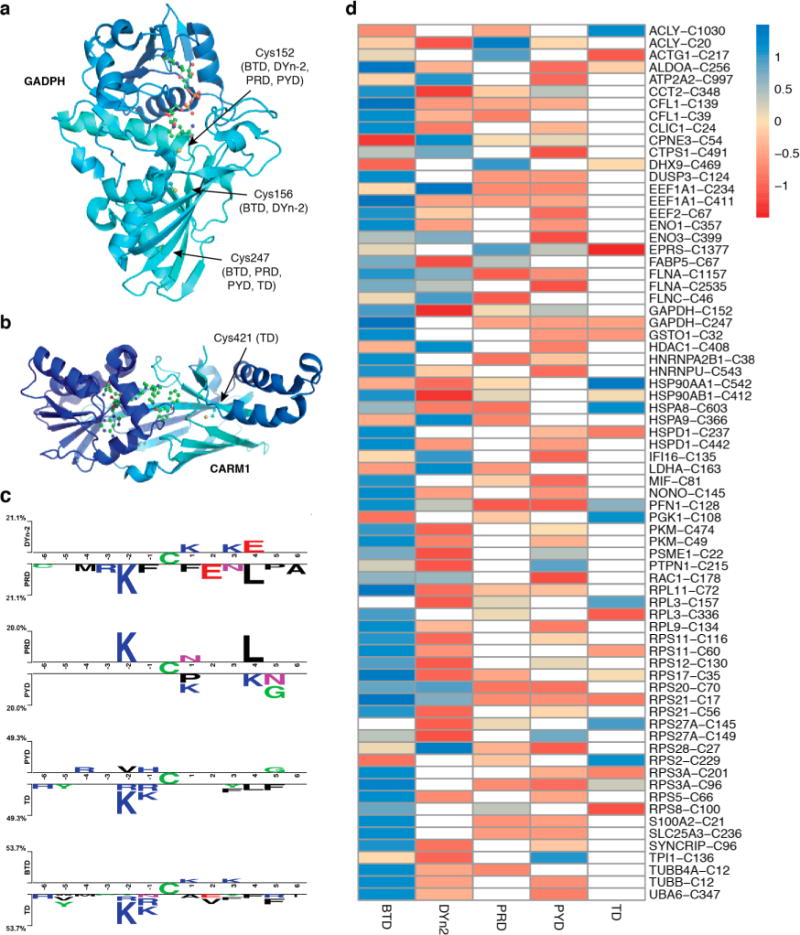
Figure 4.

Chemoproteomic analysis of RKO cellular S-sulfenylome. (a) Crystal structures of GAPDH (PDB: 4WNC) showing Cys152, Cys156, and Cys247 labeled by different probes. (b) CARM1 (PDB: 5U4X) showing Cys421 that is labeled by TD. (c) Comparative sequence analysis of peptides labeled with different probes. (d) Heat map of Z-score normalized peak intensities of S-sulfenylated sites labeled with various probes. Values in each row direction have been mean centered and scaled.
