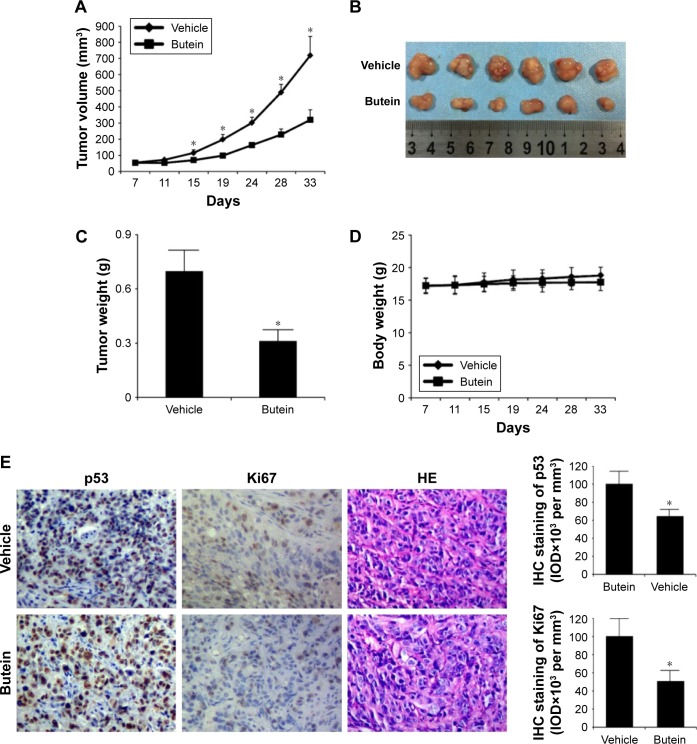
Figure 6.
Butein inhibited HepG2 xenograft growth in vivo.
Notes: (A) The tumor growth curve. (B) The photograph of the tumors. (C) The tumor weights in the vehicle- and the butein-treated group, *p<0.05 versus the vehicle. Nude mice with HepG2 xenograft were randomly assigned into the vehicle or the treatment group, and the treatment was intraperitoneally injected (5 mg/kg butein) three times per week; the tumor volume was recorded twice per week. (D) Body weight of tumor-bearing mice in vehicle- and butein-treated group. (E) The expression of p53 and Ki67 in tumor tissue. The tumor tissue of HepG2 xenograft model was stained through immunohistochemistry with the indicated antibodies. Left: representative images of immunohistochemistry staining. Right: quantification of indicated marker. *p<0.05 indicated significant difference.

