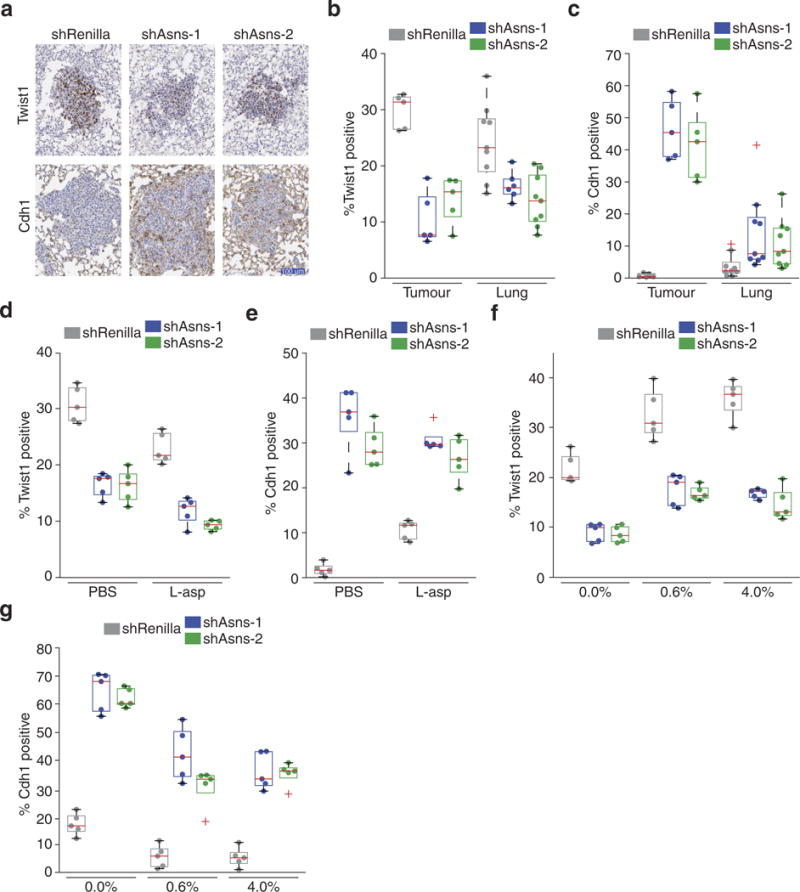
Extended Data Figure 11. Quaternary validation that asparagine availability regulates EMT.

a, Representative images of IHC staining for Twist1 and Cdh1 on sections from lungs described in Fig. 4e, in which mice were injected orthotopically with Asns-silenced and -expressing 4T1-T cells. b, Quantification of all Twist1 stainings, described in Fig. 4e and a (n = 5 tumour sections and n > 5 lung metastases, edges of the box are the 25th and 75th percentiles and error bars extend to the values q3 + w(q3 − q1) and q1 − w(q3 − q1), in which w is 1.5 and q1 and q3 are the 25th and 75th percentiles, which is also the case for c–g, rank-sum P < 0.01 and P < 0.05 for Asns-silenced versus -expressing tumours and metastases, respectively). c, Quantification of all Cdh1 stainings, described in b (n = 5 tumour sections and n = 9 lung metastases, rank-sum P < 0.01 and P < 0.05 for Asns-silenced versus -expressing tumours and metastases, respectively). d, Quantification of Twist1-positive regions in the tumours resulting from orthotopic injection of Asns-expressing and -silenced 4T1-T cells into animals treated with PBS or l-asparaginase (n = 5 tumour sections per condition, rank-sum P < 0.01 for Asns-silenced versus -unsilenced cells and rank-sum P < 0.05 for each cell line in treated versus untreated mice). e, Quantification of Cdh1-positive regions in the tumours described in d (n = 5 tumour sections per condition, rank-sum P < 0.01 for Asns-silenced versus -unsilenced cells and rank-sum P < 0.05 for each cell line in treated versus untreated mice). f, Quantification of Twist1- positive regions in tumours resulting from orthotopic injection of Asnsexpressing and -silenced cells into mice fed a 0%, 0.6%, or 4% asparagine diet (n = 5 tumour sections per condition, rank-sum P < 0.01 between Asns-silenced and -expressing cells and between diets). g, Quantification of Cdh1-positive regions in the tumours described in f (n = 5 tumour sections per condition, rank-sum P < 0.01 between Asns-silenced and -expressing cells and between diets).
