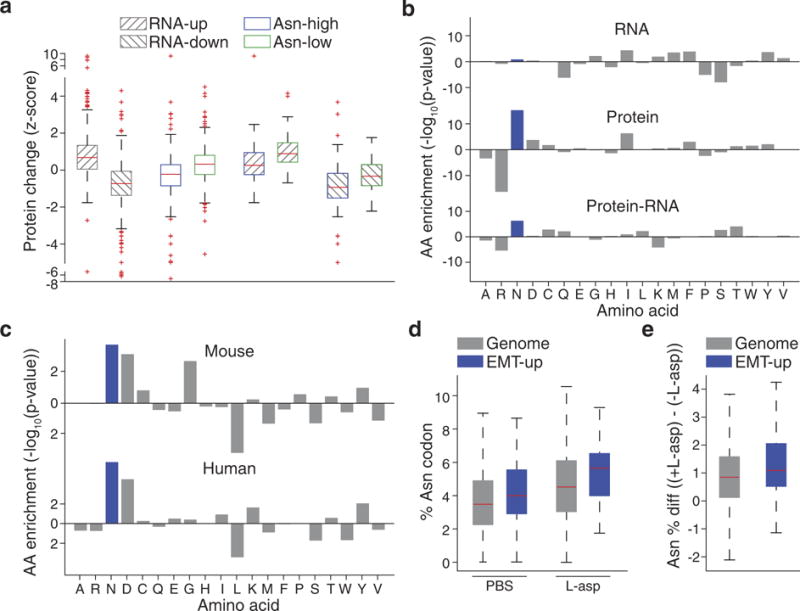
Extended Data Figure 7. Primary validation that asparagine availability regulates EMT.

a, Protein-level changes between Asnssilenced and -expressing cells when genes are stratified by transcriptionlevel changes (top and bottom 10% of genes based on log-fold change in Asns-silenced cells, gene-up and -down, respectively) and asparagine content (top and bottom 10% of genes based on asparagine content, Asp-high and -low, respectively), edges of the box are the 25th and 75th percentiles and error bars extend to the values q3 + w(q3 − q1) and q1 − w(q3 − q1), in which w is 1.5 and q1 and q3 are the 25th and 75th percentiles, which is also the case for d and e, rank-sum P < 5.0 × 10⁻²⁴ for both individual variables, and rank-sum P < 0.005 for interacting variables). b, Amino acid enrichment analysis of downregulated genes (bottom 25% based on log-fold change) on the basis of RNA and protein levels in Asns-expressing versus -silenced 4T1-T cells. Negative correlations indicate the amino acid is depleted in the downregulated genes, whereas positive correlations indicate the amino acid is enriched. For protein minus RNA level expression changes, amino acids with positive correlations are enriched in proteins in which depletion levels exceed what is predicted by corresponding RNA changes. Negative correlations indicate the amino acid is enriched in proteins in which depletion levels are less than what is predicted by corresponding RNA changes (rank-sum P < 1.0 × 10⁻⁵ for asparagine in protein and protein– RNA). c, Amino-acid enrichment in mouse and human EMT-up proteins (rank-sum P < 0.01 for both human and mouse). d, Position 15 asparagine codon enrichment in ribosome protected fragments from PC-3 cells grown with and without l-asparaginase, when all genes or only EMT-up genes are analysed (outliers were not plotted to improve interpretability, which is also the case for e, rank-sum P < 0.05 for EMT-up versus all genes in both untreated and l-asparaginase-treated cells). e, Increase in asparagine codon representation in ribosome protected fragments, when PC-3 cells are grown in l-asparaginase (relative to without), and all genes or EMT-up genes are analysed (rank-sum P < 0.05). See Source Data.
