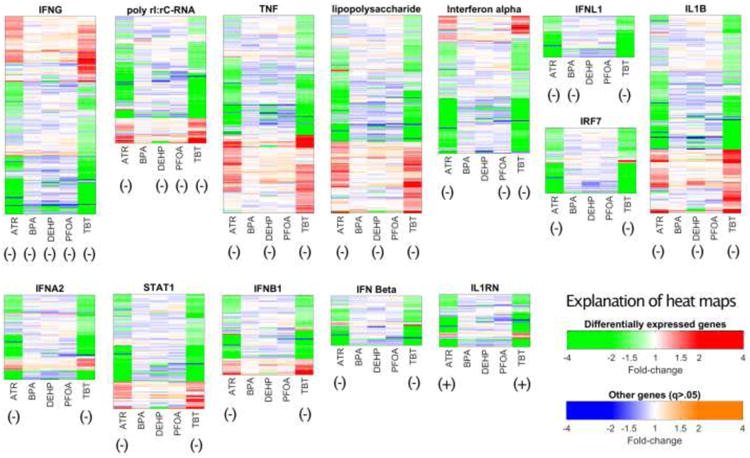
Figure 2.

Heat maps summarizing differential expression of genes downstream of the indicated (above heat maps) upstream regulators. Each heat map illustrates the degree to which effects on individual gene expression (increase or decrease) are shared by two or more treatments, for downstream genes affected by at least one toxicant. Green and red denote genes that are significantly (q < 0.05) downregulated (green) or upregulated (red). Blue and orange indicate genes with reduced (blue) or increased (orange) expression that was not statistically significant (q > 0.05). Overall predictions of activation or inhibition of upstream regulator actions are indicated by annotations below each map, with (+) indicating activation (z > 1.96) and (-) indicating inhibition (z < - 1.96). Details of effects are provided in Tables 6 and S25.
