
Figure 4. E6155 enhanced phosphorylation of AMPK and AKT in type 2 diabetic KKAy mice and cultured cells.
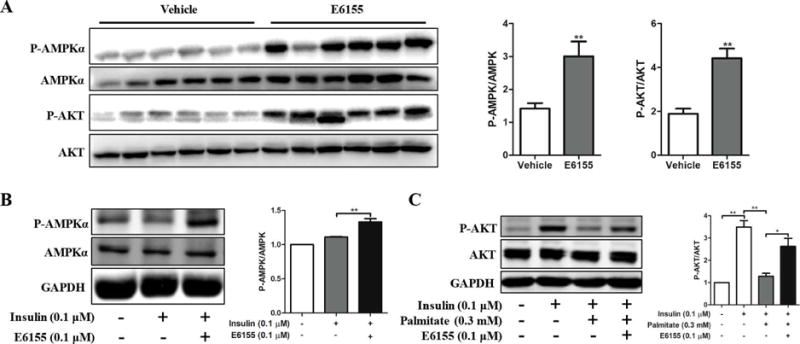
(A) Western Blots analysis of P-AMPKα, AMPKα, P-AKT and AKT in liver from KKAy mice treated with or without E6155. Representative immunoblots are shown. Values are expressed as means ± SEM, 2-tailed, paired t-test, *p < 0.05, **p < 0.01, vs vehicle group, n=12. (B) Protein levels of P-AMPKα and AMPKα in HepG2 cells. Cells were pretreated with E6155 (0.1μM) for 6 h, then insulin (0.1μM) was added for 15 min, respectively. (C) P-AKT and AKT levels were determined by Western blotting in HepG2 cells. Cells were pretreated with Palmitate (0.3mM) for 18 h, then cells were treated with E6155 (0.1μM) for 6 h, and insulin was added for 15 min finally. (B–C) Data are presented as mean±SEM, One-way ANOVA (nonparametric, Bonferroni’s multiple comparison test), *p<0.05, **p<0.01, n=3.