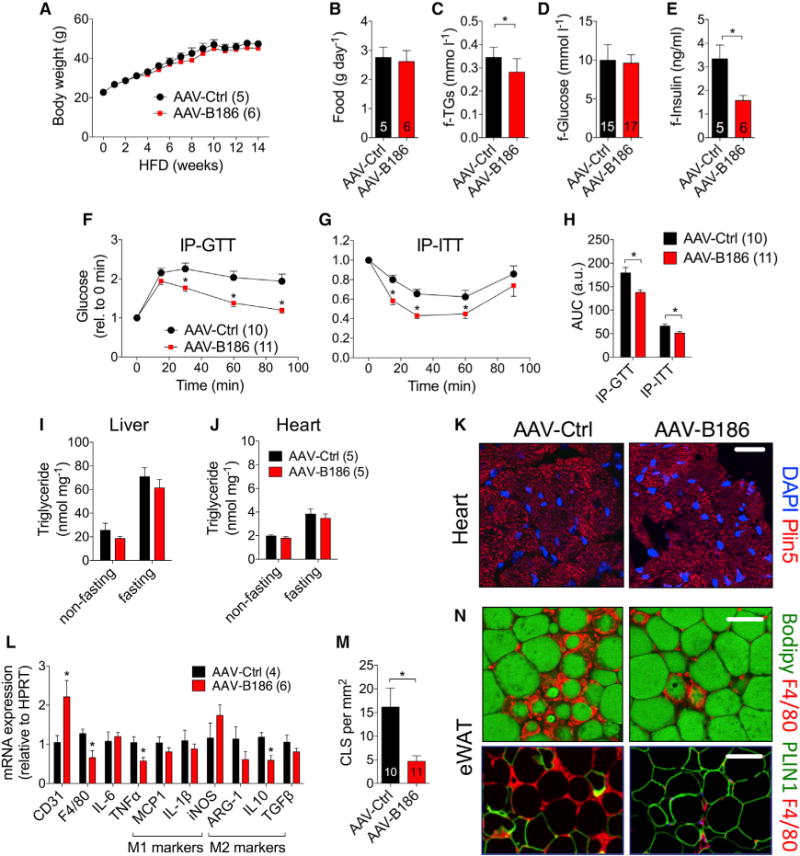
Figure 1. Improved Lipid and Glucose Metabolism but No Changes in Ectopic Lipid Deposition in HFD-Fed AAV-B186-Expressing Mice.

C57BL/6JOlaHsd males transduced with AAVs and fed a HFD were used for the experiments.
(A–E) Comparison of (A) body weight, (B) food consumption, and fasting levels of (C) triglycerides, (D) glucose, and (E) insulin.
(F–H) IP-GTT (F), IP-ITT (G), and area under the curce (AUC) (H).
(I and J) Triglyceride concentration in the (I) liver and (J) heart.
(K) Visualization of lipid droplets in Plin5-stained heart sections.
(L) eWAT gene expression analysis by qPCR.
(M and N) Crown-like structure (CLS) quantification (M) from F4/80 (macrophage, red)-stained eWAT sections (N). Adipocytes were stained green for lipids (Bodipy) or perilipin 1 (PLIN1).
Scale bars, (K) 50 μm and (N) 100 μm. The number of mice is indicated in the figure. Data are represented as mean ± SEM. *p < 0.05, calculated with two-tailed unpaired t test.
