
Figure 5. Resistance to Diet-Induced Obesity and Associated Metabolic Complications in Flt1-ECKO Mice Transduced with AAV-B186.
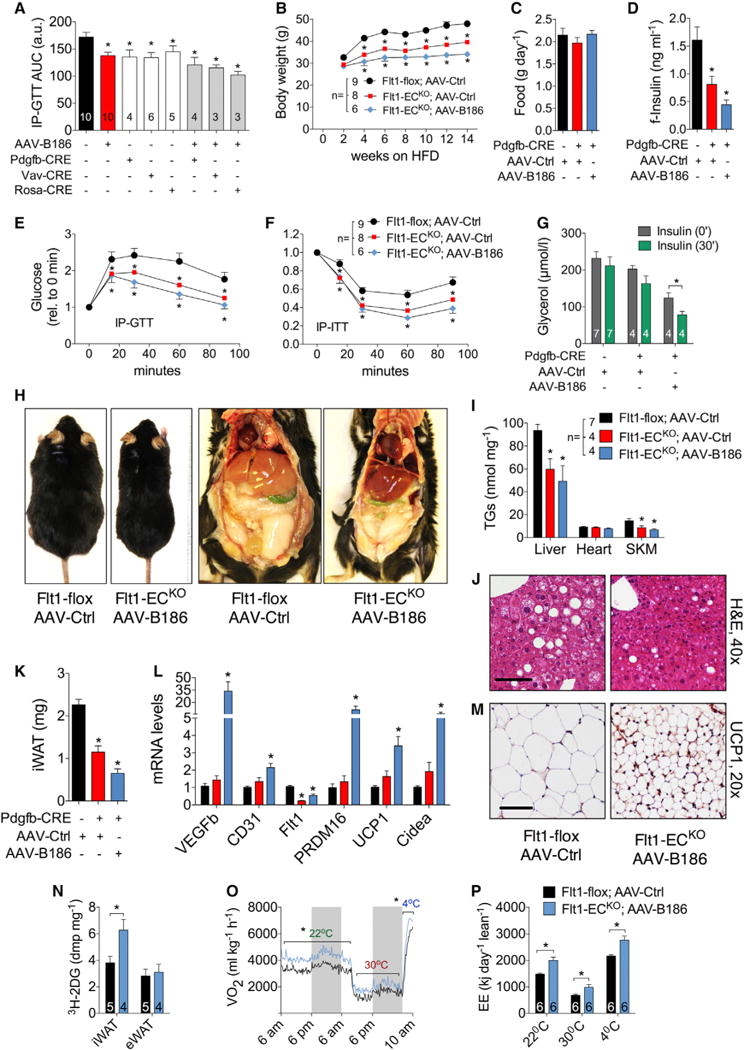
Flt1-flox male mice on a standard diet (A) or HFD (B–P) were used for the experiments. The mice in control groups were transduced with AAV-Ctrl.
(A) Area under curve from IP-GTT performed in the indicated Flt1-flox;Cre transgenic mouse lines treated with tamoxifen and transduced with AAV-Ctrl or AAV-B186.
(B and C) Body weight (B) and food consumption (C) measurements.
(D–F) Fasting serum insulin (D), IP-GTT (E), and IP-ITT (F) for 6–7 weeks of HFD.
(G) Adipose tissue response to insulin.
(H) Representative necropsy images.
(I) Triglyceride levels in tissues.
(J) H&E staining of paraffin sections from the liver.
(K–M) iWAT weight (K), gene expression (L), and UCP-1 immunohistochemistry (M).
(N) Insulin stimulated 2DG uptake in iWAT and eWAT.
(O and P) Oxygen consumption (O) and energy expenditure (P) assessed using metabolic cages.
Scale bar, 50 μm. The number of mice is indicated in the figure. Data are represented as mean ± SEM. *p < 0.05, calculated with one-way ANOVA, Holm-Sidak’s multiple comparisons test (A–H and J) or two-tailed paired t test (I) when compared to the untreated group (insulin, 0 min).