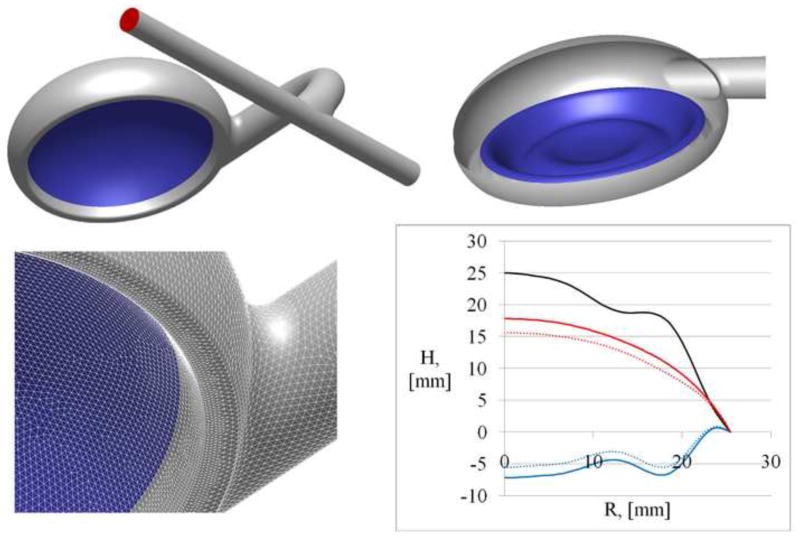
Figure 3.
Geometry of the Symphony chamber with the graft anastomosed to the axillary artery and the pump membrane (blue surface) at nearly full empty position (top left) and full filled position (top right). A detailed view of the surface mesh generated for the blood chamber with the pre-processor Gambit® to conduct the CFD study (bottom left). Bottom right subfigure shows curves representing the membrane shapes for the fully emptied condition (red line) and for the fully filled condition (blue line). The dotted blue and red lines indicate the two membrane positions used for the CFD simulation. The blue dotted line shows the membrane position shortly after the start of emptying and shortly before the end of filling. The red dotted line shows the membrane position close to the end of emptying and shortly after start of filling. The black line represents the difference between two end positions of the membrane.

