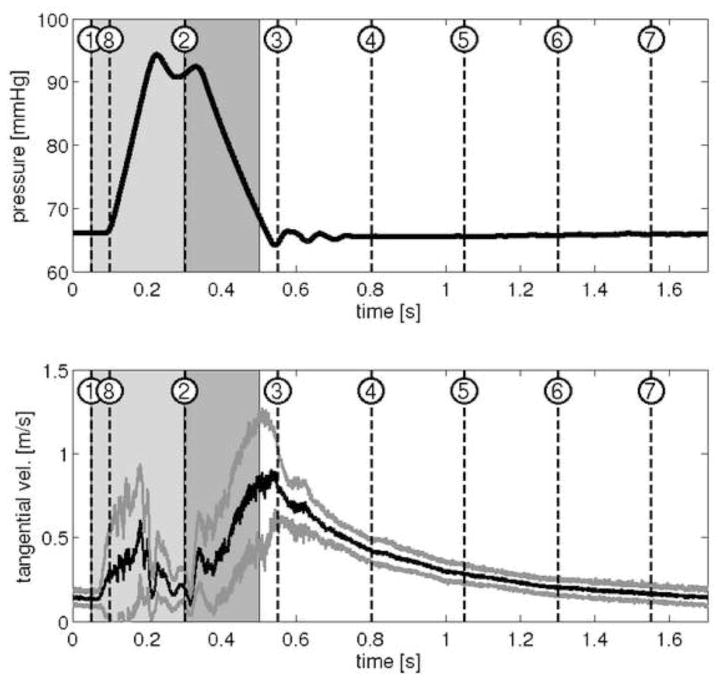
Figure 4.
Upper image shows pressure curve in the Symphony during PIV study with marked time steps. Lower image shows an analysis of the mean tangential velocity (black line) with standard deviations (grey lines) during the pump cycle. Period between each time step is 250ms with the 8th time step overlapping in the next pump cycle.

