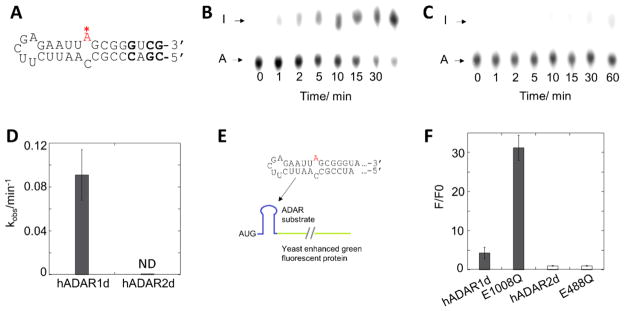
Figure 3.
Deamination of hADAR1d and hADAR2d on a 33 nt HER1 substrate and construction of a HER1-based reporter. A) Structure of the 33 nt HER1 substrate predicted by Mfold. Positions where are modified from the native HER1 RNA are bolded. B) and C) Editing of the 33 nt HER1 substrate (10 nM) by 150 nM hADAR1d (B) and 150 nM hADAR2d (C) at different time points. D) Plot of kobs for hADAR1d and hADAR2d editing the 33 nt HER1 substrate. Error bar indicates SD, n≥3. ND: non-detectable. E) Components of the HER1 fluorescent reporter. F) Characterization of the HER1 reporter with different ADAR proteins. F/F0 is the ratio of sample fluorescence divided by negative control (inactive mutant) fluorescence. Error bar indicates SD, n≥3.

