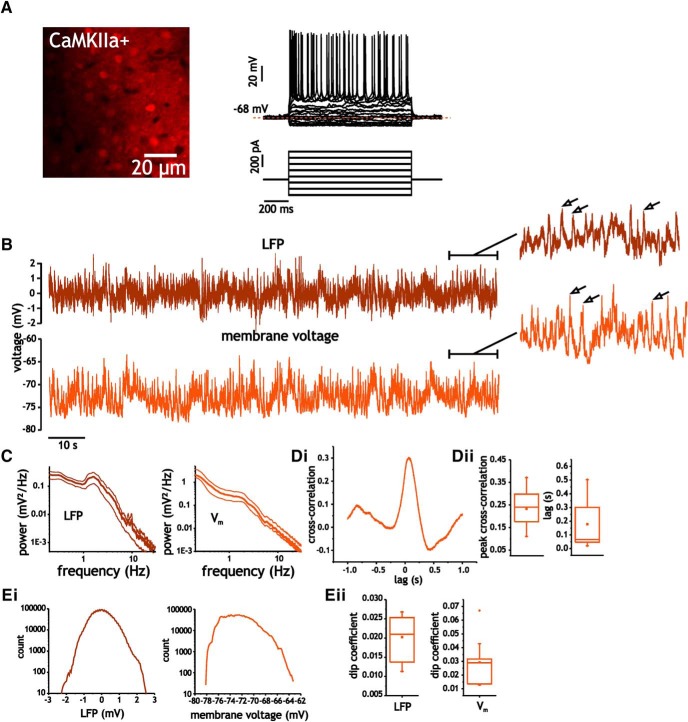
Figure 1.
LFP and intracellular membrane voltage traces under awake conditions express unimodal distributions with no evidence of up-down state transitions. A, Representative intracellular recording from a CaMKIIa-positive neuron in layer 2/3 somatosensory cortex of mouse. B, Representative recordings of LFP and intracellular membrane voltage during quiet waking states. The inset shows the last 15 s of the LFP and membrane voltage traces. Arrows indicate the presence of large depolarizations resulting from synchronous synaptic activity. C, Average power spectral density curves (thick lines indicate mean, thin lines indicate standard error from mean). D, Example cross-correlogram (i) of LFP and membrane voltage trace shown in B, as well as average peak cross-correlation coefficients (ii) and absolute lag of peak cross-correlation value (ii, right). E, LFP and membrane voltage traces express unimodal distributions. Example histograms of LFP and membrane voltage traces (i), as well as average dip coefficients for LFP and membrane voltage (ii).

