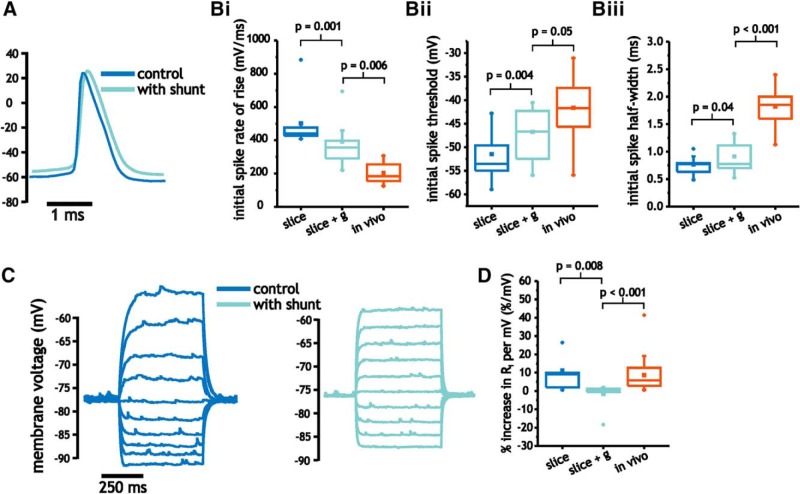
Figure 6.
Comparison of pyramidal cell spike shape and I-V curve under control and with added conductance. A, Example of spike shape under control and with added conductance. B, Plot of average initial spike rate of rise (i), spike threshold (ii), and half-width (iii) for pyramidal cells under control and with added conductance, as well as under in vivo conditions. C, Example traces of subthreshold membrane voltage in response to step depolarization between −90 and −50 mV under control and with added conductance. D, Comparison of average percentage increase in subthreshold membrane resistance under control and with added conductance, as well as under in vivo conditions.

