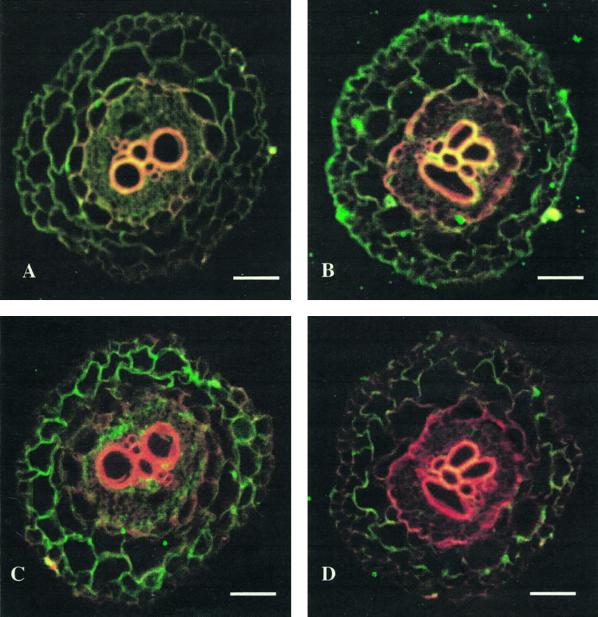
Figure 8.
Cell-specific changes in MIP-A and MIP-F following salt stress in M. crystallinum immature roots. Immunocytological analysis of MIP-A (A and B) and MIP-F (C and D) indicated persistence of the MIP-A signal following salt stress (B), while the signal for MIP-F declined (D). Root tips were obtained from plants grown in hydroponic culture 3 d after the addition of 400 mm NaCl, and sections were prepared as described in Figure 2. A and C, Untreated control roots for MIP-A and MIP-F, respectively. The bars represent 70 μm.

