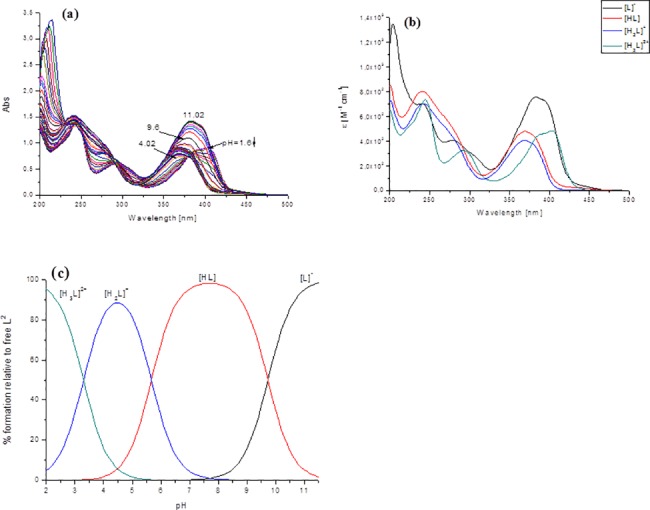
Fig 3.

(a) Absorption spectrophotometric titration vs. pH of the free L2 ligand; (b) electronic spectra of the protonated species of L2; (c) concentration distribution curves for the L2 species. (I = 0.1 M (KCl) in 80% (w/w) MeOH/H2O; T = 25.0°C; [L2] = 5x10⁻⁵M; pH 1.6–11.02).
