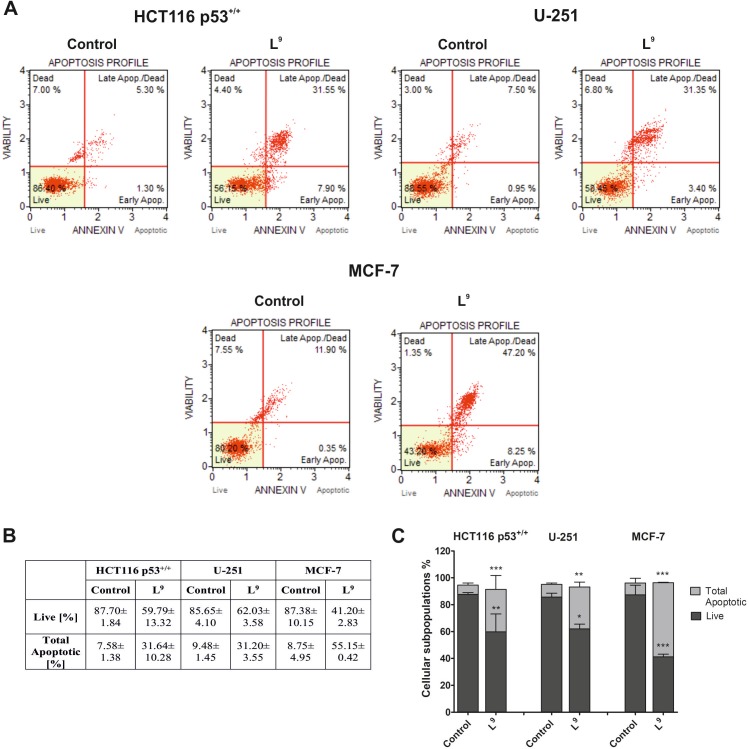
Fig 6. Evaluation of the induction of apoptosis in the HCT116 p53+/+, U-251 and MCF-7 cells 48 h after treatment with L9.
The histograms show the percentage of early and late apoptosis for one of three independent experiments (A). The table shows the mean ± SD percentage of live, early and late apoptotic cells from three independent experiments (B). Data were analyzed using one-way ANOVA with Bonferroni’s post-hoc test: *p<0.05, **p<0.01, ***p<0.001 compared to the control (C).

