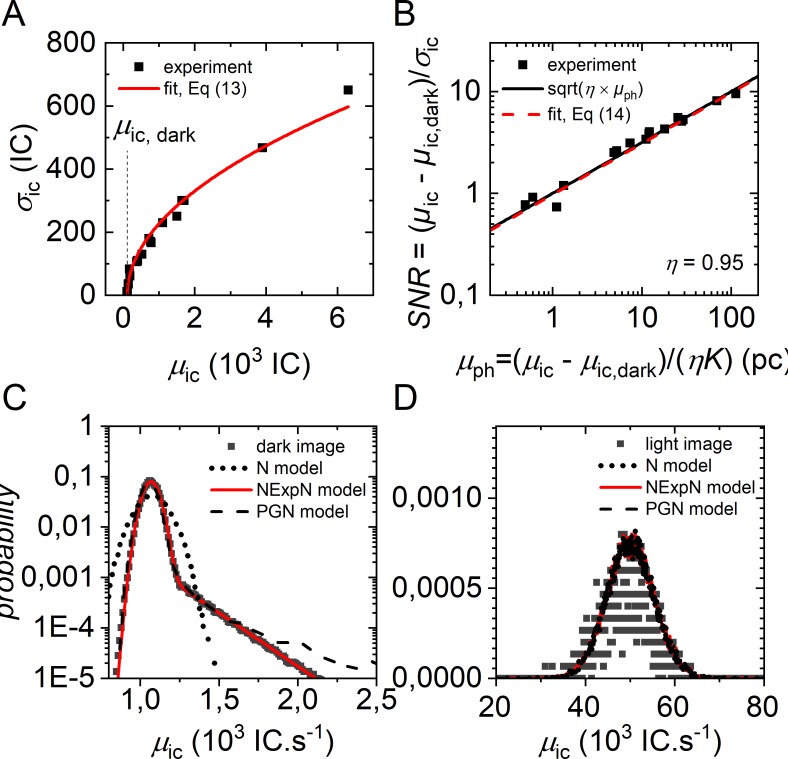
Fig 4. Camera noise simulation.
Representative experimental camera noise of an Andor iXon3 DU 897D camera, following EMVA Standard 1288 notation [42]. (A) Standard deviation of camera noise as determined from single pixel temporal intensity fluctuations over 100 frames of single Cy3-labeled RNA with EM gain = 300, tbin = 100 ms and a readout rate of 10 MHz. Excitation intensities were varied to yield mean signal intensity rates between 0 and 6000 image counts per frame. Fitting with Eq (13) yields: K = 57.7 IC e-1, μic,dark = 113 IC e, σd = 0.067 e and σq = 0 IC (B) SNR characteristics of the dark count corrected intensity signal in comparison to an ideal image sensor. The camera units (image counts) were converted into photon counts according to Eq (12). (C) Histogram of the experimentally observed image counts with closed shutter (dark image) for the characterization of CIC noise. Pixel intensities were collected from L = 100 video frames (512×512) using the same settings as in (A). Fitting with the NexpN model in Eq (9) resulted in μoe = 1069 IC.s-1, ACIC = 0.02 and τCIC = 205 IC s-1. PGN noise model parameter (50000 samples): μph = 0 pc, CIC = 0.02 e, others as determined in (A). N noise model parameter (50000 samples): μph = 0.02 pc (D) Histogram of experimentally observed image counts of a single time trace (1000 frames) of Cy3 labelled RNA. PGN noise model (50000 samples): μph = 85 pc, CIC = 0.02, others as determined in (A). Parameters of the NexpN noise model in Eq (9) and the Normal distribution in Eq (10) are chosen in the same way as for the PGN noise model.

