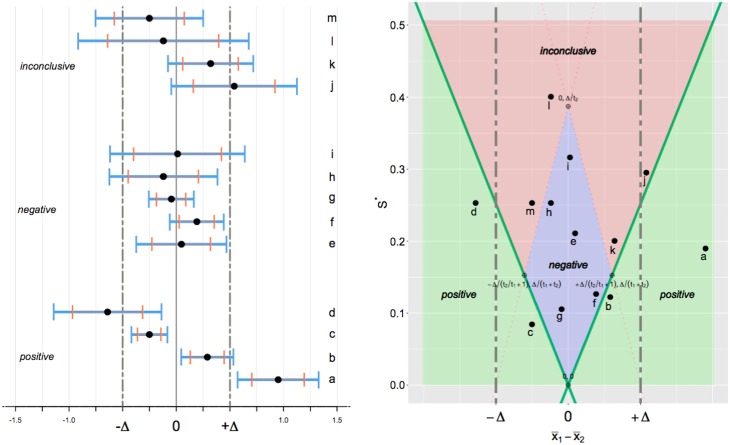
Fig 1. Left panel—CET point estimates and confidence intervals.
Point estimates and confidence intervals of thirteen possible results from two-sample testing of normally distributed data are presented alongside their corresponding conclusions. Let n = 90, Δ = 0.5, α1 = 0.05 and α2 = 0.10. Black points indicate point estimates; blue lines (wider intervals) represent (1-α1)% confidence intervals; and orange lines (shorter intervals) represent (1-2α2)% confidence intervals. Right panel- Rejection regions. Let , . The values of (on the x-axis) and (on the y-axis) are obtained from the data. The three conclusions, positive, negative, inconclusive correspond to the three areas shaded in green, blue and red respectively. The black lettered points correspond to the thirteen scenarios on the left panel.

