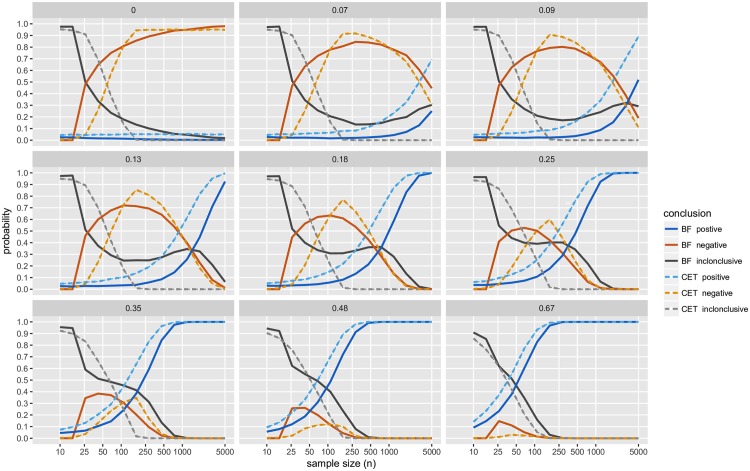
Fig 4. Simulation study results: Conclusions; with BF threshold of 3:1.
The probability of obtaining each conclusion by Bayesian testing scheme (JZS-BF with fixed sample size design, BF threshold of 3:1) and CET (α1 = 0.05, α2 = 0.10). Each panel displays the results of simulations with true mean difference, μd = 0, 0.07, 0.09, 0.13, 0.18, 0.25, 0.35, 0.48, and 0.67.

